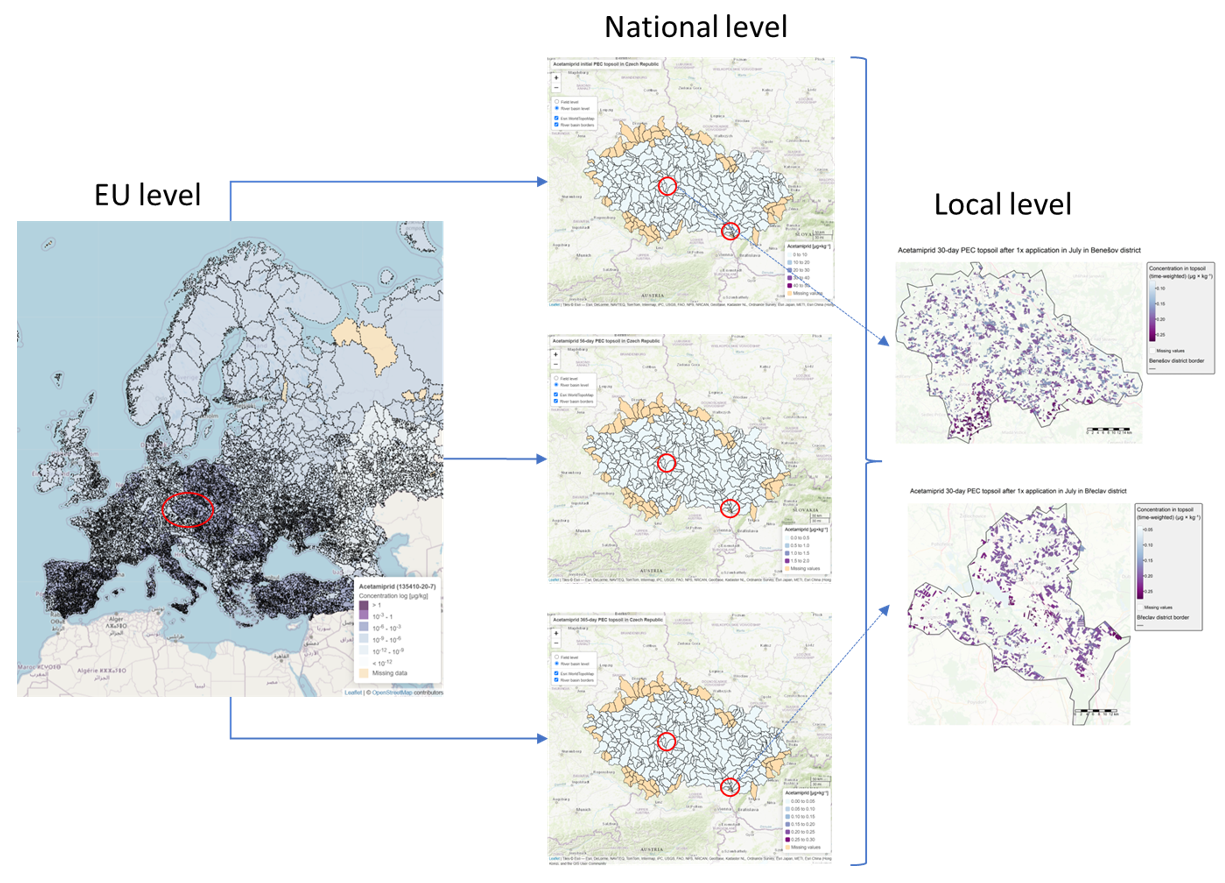
The concentration maps created in the SPRINT project can help to identify the spatio-temporal cumulation of pesticide exposures in the environment resulting from the spatio-temporal combination of crops and pesticide applications. Also, the highest-risk pesticide application patterns and cropping systems can be determined from analyses of source data for these maps. Using these maps, policymakers and regulators can more effectively target interventions and prioritize actions for informed pesticide reduction strategies (e.g., targeted reduction, withdrawal, or substitution).
The Concentration Maps bring three different tools:
1. Field-resolution Concentration Maps:
This tool demonstrates spatio-temporal simulation methods to estimate pesticide concentrations in soil and river water at individual field-resolution and river-segment-resolution (distributed modelling). It uses detailed data on farming practices, climate, soil properties, and hydrology to simulate pesticide interactions within soil and water systems. The tool is demonstrated on three randomly selected districts from Czechia, but the approach is applicable wherever the required input data are available.
2. National Concentration Maps:
These maps spatially aggregate the finer resolution data to coarser scales, such as river basins or country districts. These maps are available for soil, river water and air. For air, it calculates concentrations in the air at varying time resolutions, accounting for initial spray drift and subsequent volatilization of active substances from treated surfaces. The model estimates airborne concentrations based on factors like application method, meteorological conditions, and crop canopy characteristics.
3. Pan-European Maps:
This tool provides EU-level concentration maps for various environmental compartments, including agricultural soil, natural soil, freshwater bodies, and the atmosphere. These maps offer annual average concentrations across Europe at high spatial resolution, integrating real-world pesticide usage data (2016–2020) with environmental emission and fate models. The maps are modeling outputs rather than direct field measurements.
Comparison between Tools
Different modelling approaches and input data were used for each environmental compartment and each resolution level.
Scales, Resolutions and Spatial Units
The tools cover different spatial scales and resolutions, from individual fields to the entire European continent.
- Smallest Spatial Unit:
- field-resolution soil and surface water maps: the smallest "target spatial unit" is the individual field or river segment.
- spatially-aggregated national soil and water maps: the spatial units are river basins
- national/local air concentration maps: concentrations are calculated on grids (e.g., 1 km2 or 2.5 km2). In some cases, simulations are performed for each field, and concentrations are estimated at virtual receptor points established downwind of application sites.
- pan-European maps: the concentration is calculated based on spatially explicit modelling outputs at the river catchment level.
- Largest Spatial Range:
- The field-resolution maps focus on individual fields.
- The national maps focus on three selected EU countries (e.g., Czechia, Denmark, the Netherlands).
- The pan-European maps cover the entire European continent.
Results and Units of Concentration
The results of the tools provide estimated pesticide concentrations in different environmental compartments:
- The field-resolution and national topsoil and surface water maps: The model provides time-dependent and geo-referenced deterministic Predicted Environmental Concentrations (PECs) in topsoil (in µg/kg topsoil) and river water (in µg/dm3).
- The national air concentration maps: Concentrations are in ng/m3.
- The pan-European maps: Concentrations are generated for agricultural and natural terrestrial soils (in µg/kg), freshwater bodies (in µg/L), and air (in ng/m3).
Input Data
The tools rely on diverse input data sources, combining empirical data with mechanistic modelling tools.
Temporal domain
- The field-resolution and national topsoil and surface water maps provide temporal profiles, including initial values right after application and time-averaged values over the simulation scenario duration.
- The national air concentration maps provide output data based on annual averages or modes.
- The pan-European maps offer annual average concentrations.
Complementarity between Tools
These tools complement each other by providing different spatial resolutions for different environmental compartments. The pan-European maps offer a broad overview and can help identify general hotspots, while the national and field-resolution maps provide more granular data at finer levels, that are useful for local and national risk assessments and monitoring.
Comparability of the Results
The results across the tools are not always directly comparable due to differences in modelling approaches and input data. For example, the pan-European maps represent spatially explicit modelling outputs and provide annual averages. The air concentration maps also use model-based estimations and annual averages, which do not capture short-term peaks. Individual field-resolution maps provide daily resolution of pesticide concentration in topsoil and annual average of pesticide concentration in surface water.
General Guide for the Tools Use
- Individual Use: The tools can be used individually based on the desired level of granularity. For example, the national maps are suitable for screening-level spatial analyses to identify patterns or prioritize monitoring. The Pan-European maps are useful for EU-level exposure and impact assessments on human and ecosystem health.
- Gradual Use (Recommended): A "gradual" approach is recommended, starting with the Pan-European maps to obtain an overview of areas of interest and potential hotspots (see the figure below). Both the pan-European and national concentration maps can be viewed at the level of individual watersheds. Subsequently, individual fields can be examined in the field-resolution maps to pinpoint specific locations contributing to a hotspot within a given district or watershed. If maps for a specific country, district, or chemical are not available in the Toolbox, users can generate them using the provided model documentation and guidance on input data collection. This allows for the development of tailored scenarios to estimate pesticide concentrations.