
Authors: Daniel Martins Figueiredo (d.m.figueiredo@uu.nl); Nelleke Bekkers
Last update: 03/12/2025
This tool is not a demonstration. It is designed to visualize farm-animal exposure through feed intake and assess potential risks within a small subset of the farm-animal population.
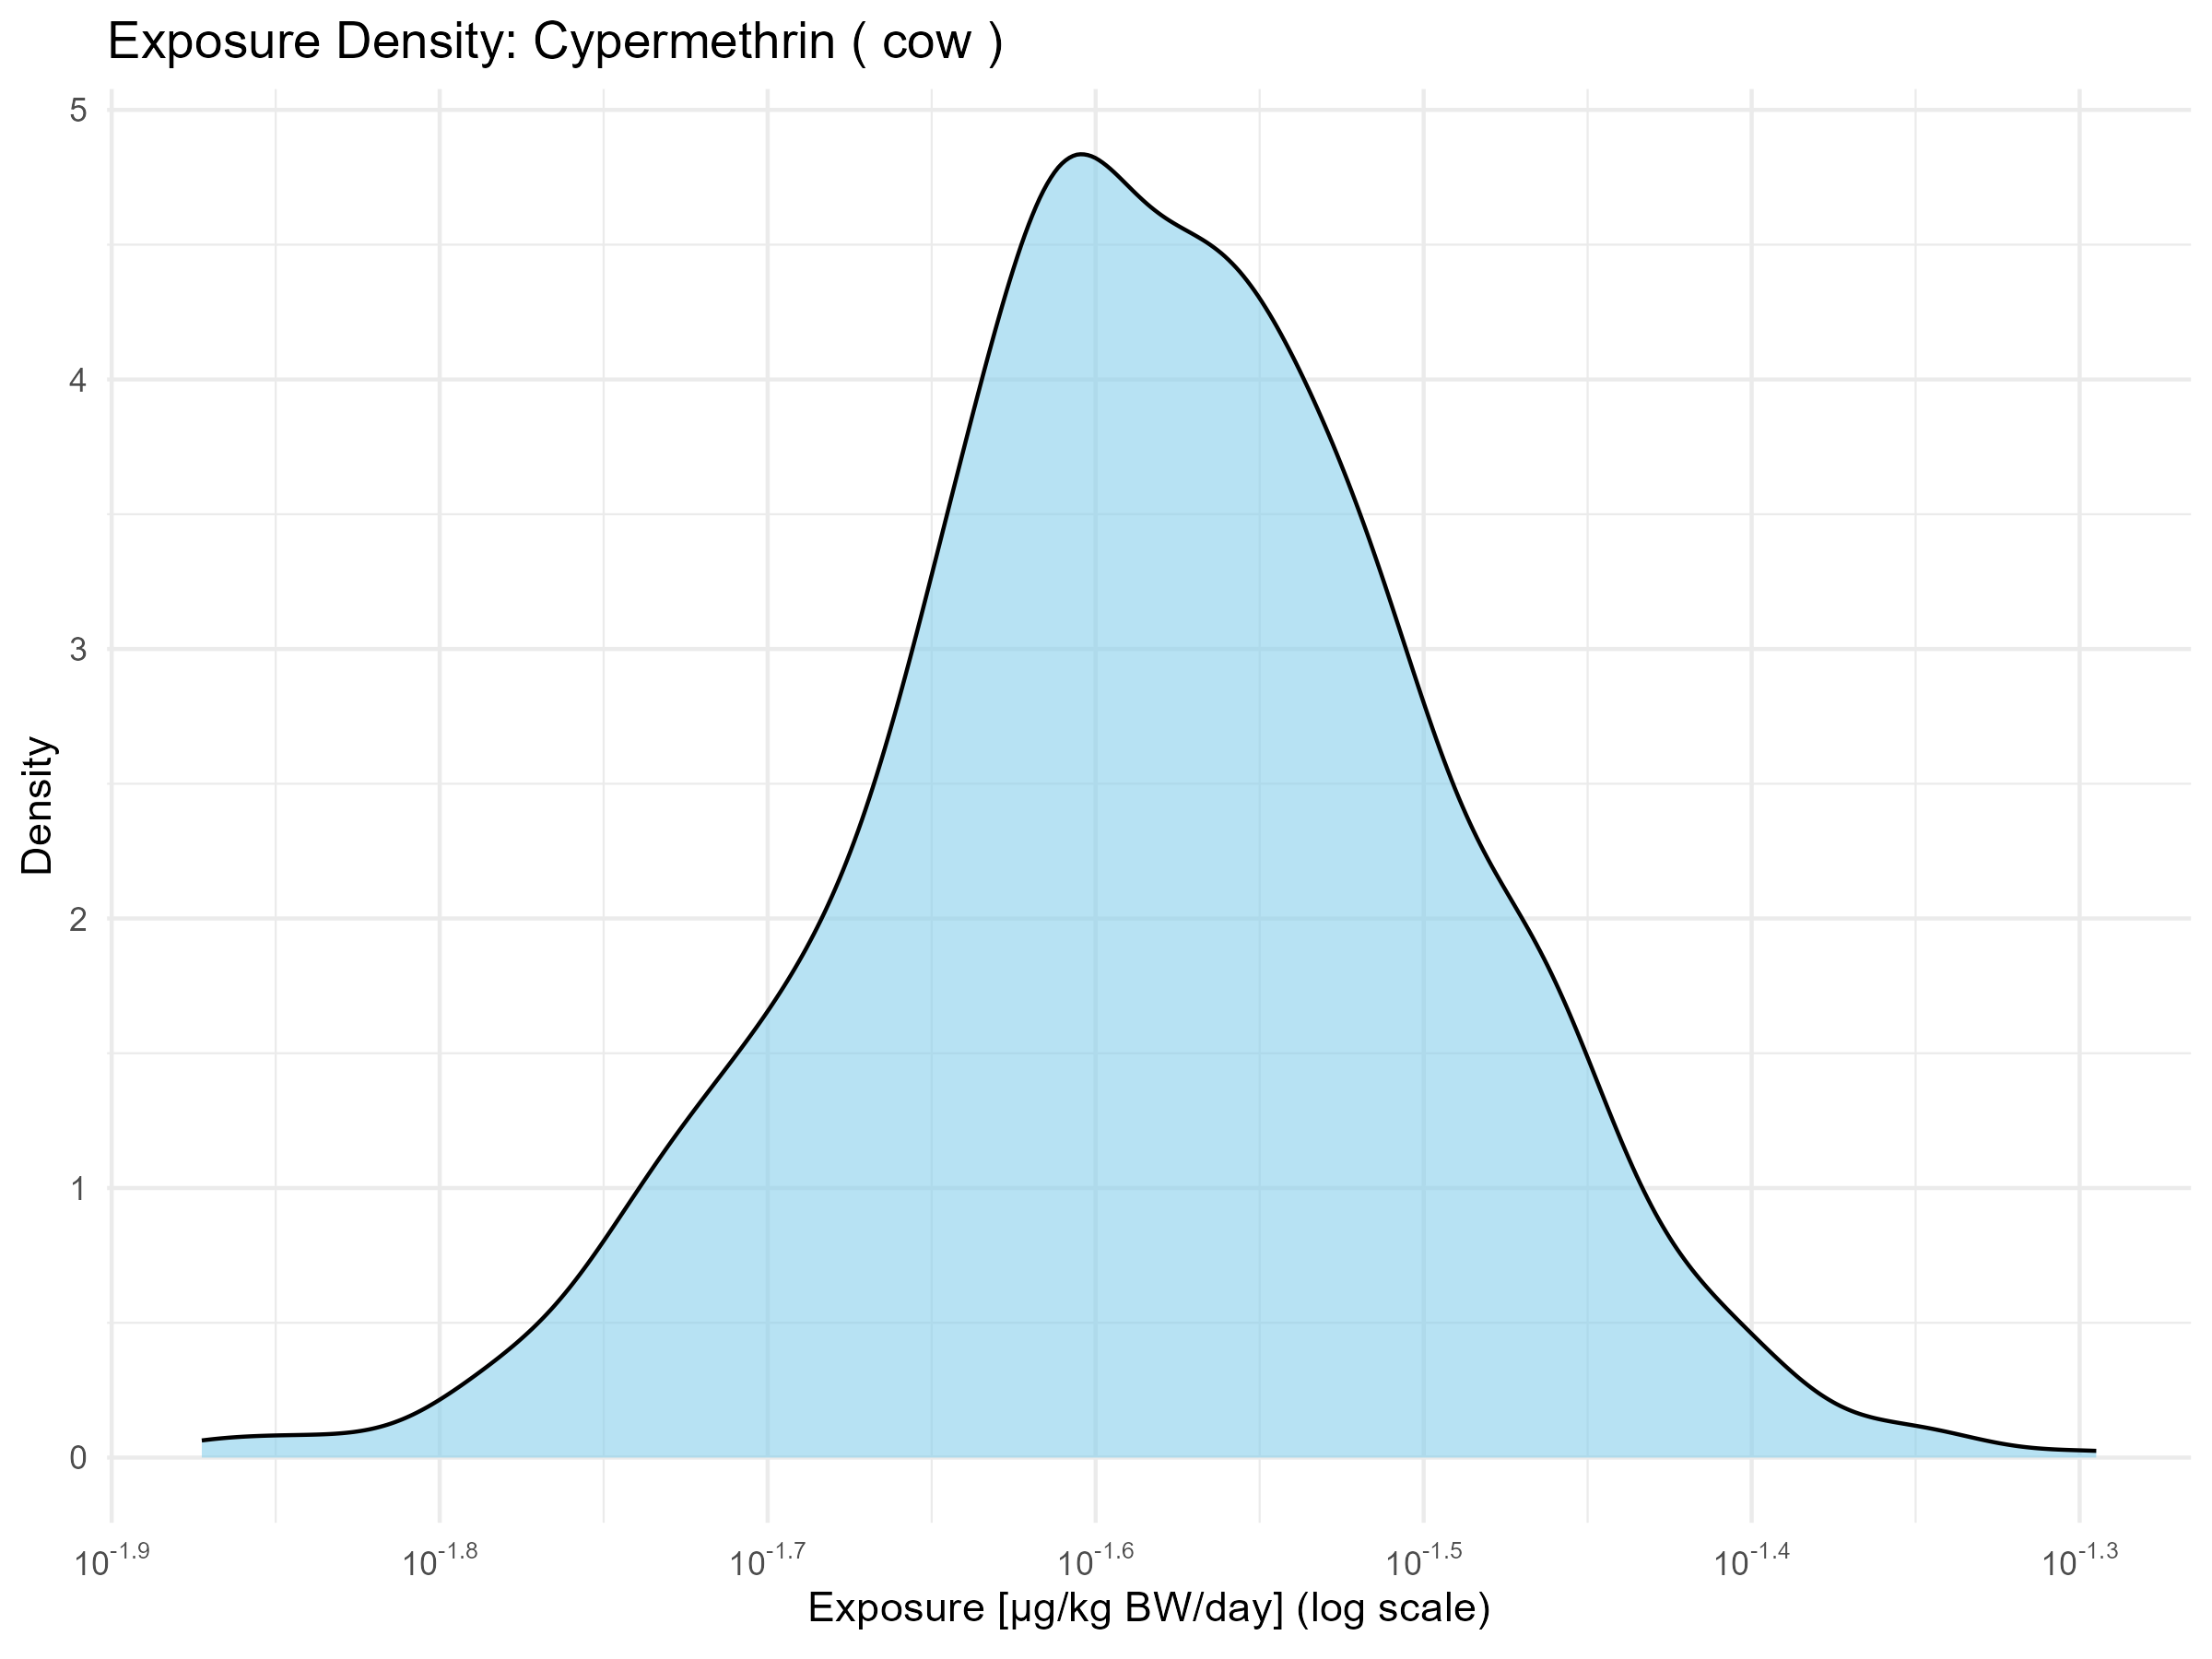
Farm-animal exposure to pesticides was assessed using Monte Carlo simulations (10,000 iterations), based on pesticide concentrations from the SPRINT feed dataset. For each farm animal, exposure was estimated by combining data across individual pesticides—only values above the limit of quantification (LOQ) were included (i.e. truncated distribution).
These pesticide levels were then paired with probabilistic distributions for both feed intake (grams/day) and bodyweight (kg), derived from a scoping review of the literature. Exposure distributions were generated using reported means and standard deviations where available. For mammals, exposure was compared with Mammals - Chronic 21d NOAEL and acute NOAEL for cows, sheep and goat. While for chickens, we compared exposure to Birds - Chronic 21d NOEL and Short term NOAEL. Data was collected from the pesticide properties database (PPDB, https://sitem.herts.ac.uk/aeru/ppdb/en/index.htm) and when not available, we searched available peer-reviewed and grey literature (e.g. EFSA reports).
The full dataset used to construct the feed intake and bodyweight distributions can be accessed here: FarmAnimal literatureReview BW&FI SPRINT NBDF. Instead of using probabilistic distributions for feed intake, one can perform a more direct assessment of Animal dietary exposure by using the default values recommend in EFSA 2024 (https://doi.org/10.2903/j.efsa.2024.8858), which focuses on the risk assessment of contaminants in feed.
The pesticides in feed data visualization can be found in Case Study Site results: Animal - Feed.
Country specific exposure calculations were not made due to limited number of samples per country.
To use the tool, select Pesticide Exposure from the menu on the left and explore results interactively by selecting the desired animal species and pesticide. Note that data availability varies: not every combination of animal and pesticide will yield data. You can loop through the items to find the combinations with data.
Description for General Public
Scientists wanted to find out how much pesticide farm animals might be exposed to through their feed. To do this, they used a computer simulation to test thousands of possible scenarios. They only used pesticide measurements that were strong enough to be reliable, and combined this with data on how much each type of animal usually eats and how much they weigh. This information came from scientific studies and was used to get the most accurate picture possible of pesticide exposure on farms. This information came from scientific studies and was used to get the most accurate picture possible of pesticide exposure on farms.
Description for Policy Makers
To estimate how much pesticide farm animals may be exposed to through their feed, researchers used a well-established simulation method called Monte Carlo modeling (10,000 runs per scenario). They analyzed feed samples from the SPRINT dataset, excluding any pesticide values that were too low to be reliably measured.
For each type of farm animal, this pesticide data was combined with estimates of how much those animals typically eat and how much they weigh—based on a comprehensive review of scientific literature. These estimates were used to create statistical distributions for more accurate and realistic exposure modeling.
Description for Scientists
Pesticide exposure in farm animals was quantitatively assessed using Monte Carlo simulations (10,000 iterations). The simulations were based on pesticide concentration data from the SPRINT feed dataset. To ensure robustness, only concentration values above the limit of quantification (LOQ) were included, resulting in a truncated distribution for each pesticide. For each animal species, total exposure was estimated by combining pesticide-specific concentrations with probabilistic estimates of feed intake (g/day) and bodyweight (kg). These distributions were derived from a scoping literature review, using reported means and standard deviations to generate representative probabilistic models for each parameter. The underlying datasets include: Feed intake and bodyweight distributions: compiled via a scoping review; Pesticide concentrations in feed: visualized in Case Study Site results.