
Authors: Shiva Sabzevari, MU (shiva.sabzevari@recetox.muni.cz)
Last update: 06/02/2026
The average dietary exposure has been calculated using monitoring data of pesticide residues in food and food consumption data for Europe.
From the left menu, users can access the maps showing the estimated average dietary exposure in addition to the related maps showing the average pesticide concentration in the food commodities. In the following sections, the users will find a description of the tool and the information it provides for three different end-user groups. We highly recommend that users study this information before using the tool.
Description for General Public
Background
Pesticides are widely used in agriculture to protect crops from pests and disease. However, their residues can remain in food commodities that eventually reach our plates. This tool brings a method to estimate the average amount of pesticides European adults may be exposed to through the food they eat. It brings detailed maps showing the estimated average dietary exposure to pesticides.
How it works
Using data from the EU as well as Iceland and Norway food monitoring programs for the years 2011 to 2020 [1,2] and national dietary surveys [3], we looked at ten popular food commodities – such as apples, tomatoes, potatoes, etc. – and calculated how much of pesticides adults may be consuming on average via eating these food commodities. Maps in this tool present, in the left side menu: 1) the average concentration (µg/kg, after imputation) of individual pesticide residues in selected food commodities, and 2) the estimated average amount of individual pesticides (µg of pesticide per kg of body weight) that adults in European countries may consume through selected food commodities for each year.
What it offers
- The estimation of real-life average dietary exposure levels.
- Highlighting the differences between countries and years, which helps identify where dietary exposure to specific pesticides might be higher.
- Support safer food and farming policies.
- Raise public awareness and provide guidance to make better choices.
Limitations / Disclaimer
It is worth noting that the presented dietary exposures are estimated values, including uncertainties. Moreover, the estimation is based on unprocessed raw commodities, meaning that any further food processing, such as washing, peeling, cooking, etc., might change (mostly lower) the final dietary intake of pesticides. The reported dietary exposure data do not present the risk, meaning that higher values do not necessarily mean that consumption of the related food commodities leads to subsequent risk to the population. Even the higher exposures mainly still remain below the safe threshold, which is defined as Acceptable Daily Intake (ADI).
The estimated average dietary exposure is based on a limited set of food commodities (the 10 most popular) consumed by adults and does not necessarily reflect the food patterns of individual European populations.
The users must bear in mind that the estimation has been done for the years 2011-2020, and updates for the years after this timeframe are not anticipated for this tool.
References:
- Carrasco Cabrera L, Medina Pastor P. The 2020 European Union report on pesticide residues in food. EFSA J 2022;20. https://doi.org/10.2903/j.efsa.2022.7215
- The 2011 European Union Report on Pesticide Residues in Food. EFSA J 2014;12. https://doi.org/10.2903/j.efsa.2014.3694
- Dujardin B, Kirwan L. The raw primary commodity (RPC) model: strengthening EFSA’s capacity to assess dietary exposure at different levels of the food chain, from raw primary commodities to foods as consumed. EFSA Support Publ 2019;16. https://doi.org/10.2903/sp.efsa.2019.EN-1532
Description for Policy Makers
Background
Ensuring the safety of the food supply is a fundamental responsibility of public health policy. As pesticides are widely used in modern agriculture to secure crop yields and reduce post-harvest losses, concerns grow around the long-term health implications of their residues in the food people consume daily. While regulatory systems currently assess dietary exposure, many rely on simplified or overly cautious assumptions that may not reflect the real exposure status. Investing in realistic dietary exposure studies helps identify which populations are most at risk, improves transparency, and supports more targeted regulations. It is an essential step toward a healthier, more informed, and more resilient food system.
How it works
This tool provides a science-based estimate of average exposure to pesticides through food consumption for European adults (in µg of individual pesticide per kg body weight per calendar year). The estimation was performed through the following procedure:
Data sources used:
- Pesticide residues in food from the EU, as well as Iceland and Norway, food monitoring program for the years 2011 to 2020 [1,2]
- Food consumption data across Europe [3]
Key steps:
- The research focused on the 10 commonly consumed primary food commodities in the EU.
- Pesticides, with sufficient and consistent data on residue concentrations, were selected for each food commodity,
- To fill data gaps (residues reported below the LOQ), statistical imputation was applied to estimate the residue values.
- Average dietary exposure was calculated using the average of imputed pesticide residue concentrations in food commodities and food consumption data for adults.
- Results were visualized as exposure maps.
What it offers
Most current dietary exposure assessments rely on limited data or unrealistic estimates. The human dietary exposure tool fills the gap by utilizing monitoring data and statistically imputing missing values to reflect more realistic exposure scenarios. It delivers country-level maps that show both: 1) the average imputed concentration of individual pesticide residues in selected food commodities, and 2) how much of a specific pesticide people may ingest through their diet. The Acceptable Daily Intake (ADI) has been provided for assessment of the probable risk. ADI data was taken from the pesticide properties database (PPDB ). The presented tool supports targeted, data-driven regulation by helping:
- Identify high-exposure regions or high-risk food commodity- pesticide combinations.
- Target monitoring efforts more effectively.
- Improve consumer safety while supporting sustainable agriculture.
The dietary exposure tool is a ready-to-use tool to help bridge science and policy, ensuring that pesticide regulations better protect public health based on actual exposure patterns.
Limitations / Disclaimer
The tool developed in this study provides valuable insights into dietary exposure to pesticides across Europe, but its results are influenced by limitations. Differences in laboratory methods among countries and gaps in national monitoring data meant that sufficient residue information was not available for all pesticide and food commodities. To address this, data imputation was performed at the European rather than national level. Additionally, the food consumption data used already included modelled estimates from the RPC database, which introduced some uncertainty. Several countries with good residue data, such as Portugal, Norway, etc., lacked corresponding consumption data and were therefore excluded. In addition, the imputation approach was constrained by the high proportion of missing data, which influenced the precision of the results and restricted the imputation variables available for use.
The estimated average dietary exposure presented in this tool is based on a selection of the 10 commonly consumed food commodities in Europe. While these foods represent a major component of the overall diet, this approach does not fully reflect the diversity of individual dietary habits across different countries, regions, or population groups. As a result, the estimates should be interpreted as indicative of general exposure patterns rather than as exact reflections of every individual’s consumption profile. Variations in cultural preferences, seasonal availability, and socio-economic factors may lead to higher or lower exposure levels in specific populations than those represented in the tool.
In addition, the estimated average dietary exposure is based on the raw food commodity consumption due to the lack of data on food processing factors for the studied food commodities and pesticides. Hence, the users must be aware that applying any kind of processing procedure, such as washing, peeling, cooking, etc., might change the final dietary intake.
It should also be noted that the estimates cover the period from 2011 to 2020. No further updates beyond this timeframe are currently planned for this tool. Consequently, users should consider that the results may not account for changes in pesticide use, regulations, agricultural practices, or food consumption patterns that occur after 2020. However, users interested in the latest results can use the tool scripts and follow the descriptions provided in the SPRINT sharing platforms to obtain the results for the years outside this timeframe.
The above-mentioned limitations highlight the need for more harmonized and complete datasets across Europe on monitoring, consumption, and food processing factors. Improving data quality and consistency at the national level would strengthen future dietary exposure assessments and enhance their value for evidence-based policymaking in food safety and pesticide regulation.
References:
- Carrasco Cabrera L, Medina Pastor P. The 2020 European Union report on pesticide residues in food. EFSA J 2022;20. https://doi.org/10.2903/j.efsa.2022.7215
- The 2011 European Union Report on Pesticide Residues in Food. EFSA J 2014;12. https://doi.org/10.2903/j.efsa.2014.3694
- Dujardin B, Kirwan L. The raw primary commodity (RPC) model: strengthening EFSA’s capacity to assess dietary exposure at different levels of the food chain, from raw primary commodities to foods as consumed. EFSA Support Publ 2019;16. https://doi.org/10.2903/sp.efsa.2019.EN-1532
Description for Scientists
Background
The increasing application of the Plant Protection Products (PPPs) in today’s farming systems has led to a continuous rise in human exposure to these chemicals. It has been shown that dietary exposure is the primary route of general population exposure to pesticides [1,2]. As a result, it is crucial to maintain food safety throughout the population to reduce exposure and the risks associated with it.
Dietary exposure is an important component of risk assessment studies. These studies follow approaches that mainly consider scenarios leading to overestimation or underestimation of the dietary exposure [3,4]. Accordingly, designing studies investigating methods representing the actual dietary exposure of general consumers seemed to be necessary.
Estimation of dietary exposure by modeling and computational methods nowadays is an alternative to the costly, time-consuming, and labor-intensive biomonitoring procedures involved in human exposure assessments; however, the main challenge of using these methods is having access to harmonized, reliable, and consistent input data [5,6].
In the human dietary exposure tool, we provided the users with the estimated average dietary exposure that the EU adult population might be exposed to in annual basis by consuming certain food commodities. The data sources and methodology, as well as the limitations of the approach, are presented in the following text. In addition, the outputs, visualized in the geospatial form, are accessible to the users from the left side menu.
How it works
The tool presents the maps of the estimated average human dietary exposure to pesticides. This tool aims to provide an estimation of the average amount of individual pesticides the European adult population might be exposed to via food consumption by imputing the missing (below LOQ) pesticide residue concentration data. The data are shown in µg of individual pesticide per kg body weight per calendar year. For this purpose, several steps were taken as follows:
Data sources used:
Two datasets were used for the dietary exposure calculations:
- Pesticide residue data – collected from food monitoring programs conducted in EU Member States, as well as Iceland and Norway. These results have been published by EFSA as open-source data, available since 2011. For this study, data for the years 2011 to 2020 were used [7,8].
- Food consumption data – detailing consumption of food in European countries at the raw primary commodity (RPC) level, sourced from Dujardin & Kirwan [9].
The table below summarizes the availability of the above-mentioned data on pesticide residue concentrations in food and the adult’s food (10 selected food commodities) consumption data for each country.
Food commodity and pesticide selection:
The food commodities, for which dietary exposure was estimated, were selected using a two-step approach. First, the total percentage of consumers for each food commodity across all EU countries, which was available in the RPC dataset, was calculated. Then, the ten primary food commodities with the highest consumer percentages were identified and selected. The selected commodities were onions, tomatoes, carrots, apples, potatoes, sweet peppers, parsley, oranges, strawberries, and lemons.
For each of the selected food commodities, the pesticides fulfilling the following conditions were selected for subsequent imputation. These conditions were necessary for accurate imputation of missing data:
- Having enough number of (>15) reports above LOQ for residue concentration in selected food commodities.
- Having a percentage of missing data (<LOQ) no more than 90%.
Imputation of missing data:
Missing data in the residue concentration dataset (concentrations reported as non-quantifiable) related to selected pesticides and selected food commodities for each year (2011 – 2020) were imputed using maximum likelihood estimation regression. The imputation was carried out to estimate the likely average pesticide residues, taking the LOQ and the origin of the sampled food commodity into account. Imputation was conducted individually for each combination of pesticide, food commodity, and year across Europe.
For the calculation of average dietary exposure, the mean imputed residue concentrations for each specific pesticide /food commodity/country/year were multiplied by the average consumption rate of the respective food commodity in each European country. The calculated dietary exposure is visualized as maps of European countries.
What it offers
The presented tool delivers country-level maps that depict 1) the average imputed concentrations of individual pesticide residues in selected food commodities and 2) the estimated average dietary intake of specific pesticides across adult populations. In addition, Acceptable Daily Intake (ADI) values are also provided for determining the probable risk. ADI data was taken from the pesticide properties database (PPDB ). This supports science by providing:
- Estimated average dietary exposure of the adult population in European countries to individual pesticides per calendar year.
- Capability to assess temporal and spatial trends in pesticide dietary intake across Europe for the period 2011–2020, providing valuable insights for epidemiological and exposure assessment studies.
- Comprehensive overview of data availability across countries, enabling identification of regions with higher-quality datasets and revealing data gaps and limitations that highlight the need for further attention in future research.
The dietary exposure tool is a ready-to-use tool to help bridge science and policy as well as increase public awareness, ensuring that pesticide regulations better protect public health based on actual exposure patterns.
Limitations / Disclaimer
This tool demonstrates the estimation of average dietary exposure. It is important to remember that there were also limitations involved in the procedure. The limitations in this tool come from both the quality of its underlying data and the challenges of imputing missing values.
There were inconsistencies presented in the database of pesticide residue concentrations, e.g., differences in analytical methods and instruments among countries that led to inconsistent LOQs. Furthermore, there was insufficient country-level data, making national-level imputation unreliable. For this reason, imputations were performed at the European level. Additional uncertainty arises from the RPC food consumption database, which we used as provided; this database already incorporates modelled estimates of raw primary commodity intake derived from composite food data [9]. The uncertainties involved in the RPC database introduce uncertainty into the exposure estimates as well. Moreover, RPC didn’t provide consumption data for several countries, such as Portugal, Iceland, Norway, and Greece, to name a few, while we had the concentration data available for (see the table below).
The imputation approach itself was also constrained by the high proportion of missing data, which could influence the precision of results and limit the number of reliable predictors that could be applied.
Together, these factors affect the overall precision of the dietary exposure estimates to some extent and impose limitations on the applicability of the tool.
The estimated average dietary exposure presented in this tool is based on a limited set of food commodities, specifically the 10 commonly consumed items, and therefore does not fully represent the diversity of dietary patterns across the European population. While these commodities account for a substantial proportion of overall food intake (based on the RPC database), individual and regional differences in consumption habits, cultural preferences, and dietary practices are not explicitly captured in the calculations. Consequently, the exposure estimates should be interpreted as population-level approximations rather than precise reflections of individual food patterns.
The users of this tool must be aware that, due to the scarcity of data on food processing factors for the studied pesticide and food commodities, the presented dietary exposure values are limited to calculations based on raw commodities without considering food processing. Applying any kind of processing procedure, such as washing, peeling, cooking, etc., might strongly influence the final dietary exposure of the consumers.
The estimates generated by this tool are limited to the period between 2011 and 2020. At present, no updates beyond this timeframe are planned, and therefore, the tool does not account for potential changes in pesticide use, regulatory frameworks, agricultural practices, or food consumption patterns that may occur after 2020. However, the interested users can perform the calculations for the years and food commodities rather than those presented in this tool, using the related scripts and descriptions provided in the SPRINT sharing platforms.
References:
- Caldas ED. Approaches for cumulative dietary risk assessment of pesticides. Curr Opin Food Sci 2023;53:101079. https://doi.org/10.1016/j.cofs.2023.101079.
- Kalyabina VP, Esimbekova EN, Kopylova K V, Kratasyuk VA. Pesticides: formulants, distribution pathways and effects on human health – a review. Toxicol Reports 2021;8:1179–92. https://doi.org/10.1016/j.toxrep.2021.06.004.
- Chatzidimitriou E, Mienne A, Pierlot S, Noel L, Sarda X. Assessment of combined risk to pesticide residues through dietary exposure. EFSA J 2019;17. https://doi.org/10.2903/j.efsa.2019.e170910.
- Sieke C. Identification of a pesticide exposure based market basket suitable for cumulative dietary risk assessments and food monitoring programmes. Food Addit Contam Part A 2020;37:989–1003. https://doi.org/10.1080/19440049.2020.1737334.
- Figueiredo DM, Vermeulen RCH, Jacobs C, Holterman HJ, van de Zande JC, van den Berg F, et al. OBOMod - Integrated modelling framework for residents’ exposure to pesticides. Sci Total Environ 2022;825:153798. https://doi.org/10.1016/j.scitotenv.2022.153798.
- Fantke P, Wieland P, Juraske R, Shaddick G, Itoiz ES, Friedrich R, et al. Parameterization Models for Pesticide Exposure via Crop Consumption. Environ Sci Technol 2012;46:12864–72. https://doi.org/10.1021/es301509u.
- Carrasco Cabrera L, Medina Pastor P. The 2020 European Union report on pesticide residues in food. EFSA J 2022;20. https://doi.org/10.2903/j.efsa.2022.7215.
- The 2011 European Union Report on Pesticide Residues in Food. EFSA J 2014;12. https://doi.org/10.2903/j.efsa.2014.3694.
- Dujardin B, Kirwan L. The raw primary commodity (RPC) model: strengthening EFSA’s capacity to assess dietary exposure at different levels of the food chain, from raw primary commodities to foods as consumed. EFSA Support Publ 2019;16. https://doi.org/10.2903/sp.efsa.2019.en-1532.
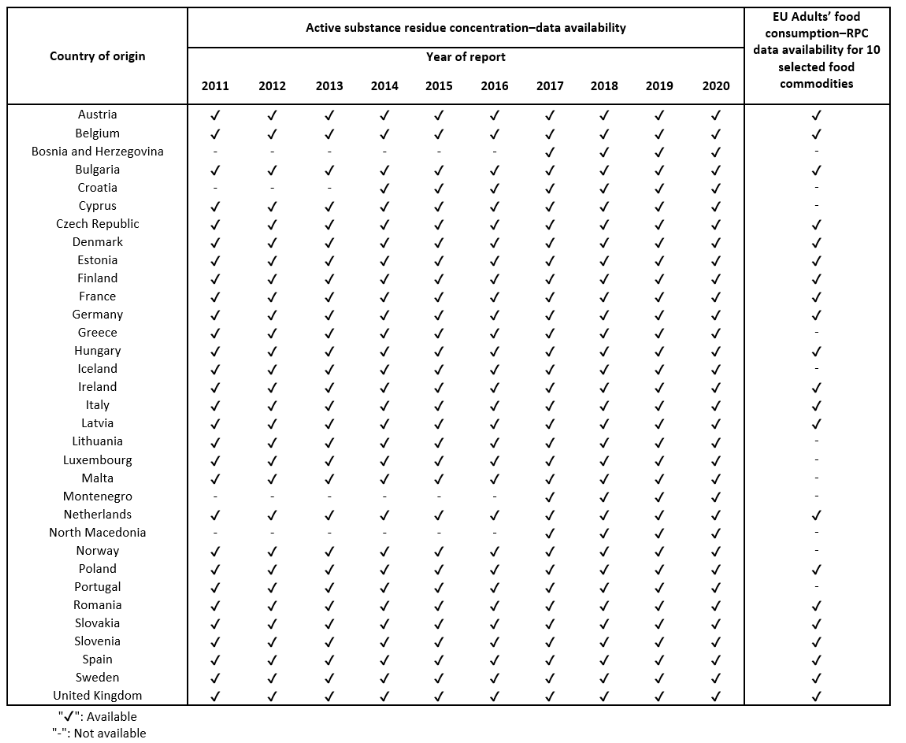
Table: The availability of data on monitoring pesticide residues in food for the years 2011 to 2020, and data on consumption of 10 selected food commodities for the adult population in the EU countries.