Ecotoxicology Results - Soil
Adverse effects were observed at pesticide concentrations corresponding to those detected in soil and those considered acceptable under current regulations.
This includes effects on earthworms and terrestrial plants when exposed to the measured environmental concentration (MEC). This means that when exposed to pesticides at the same levels detected in soil samples, adverse effects on earthworm reproduction and plant growth were observed.
Significant effects also occurred at concentrations at or below the current permissible limits. Specifically, at half the typical pesticide application rates (AR/2) for beneficial insects, one-quarter of the predicted dietary exposure quantity (PEQ/4), and the predicted environmental concentration (PEC) for springtails.
Earthworms
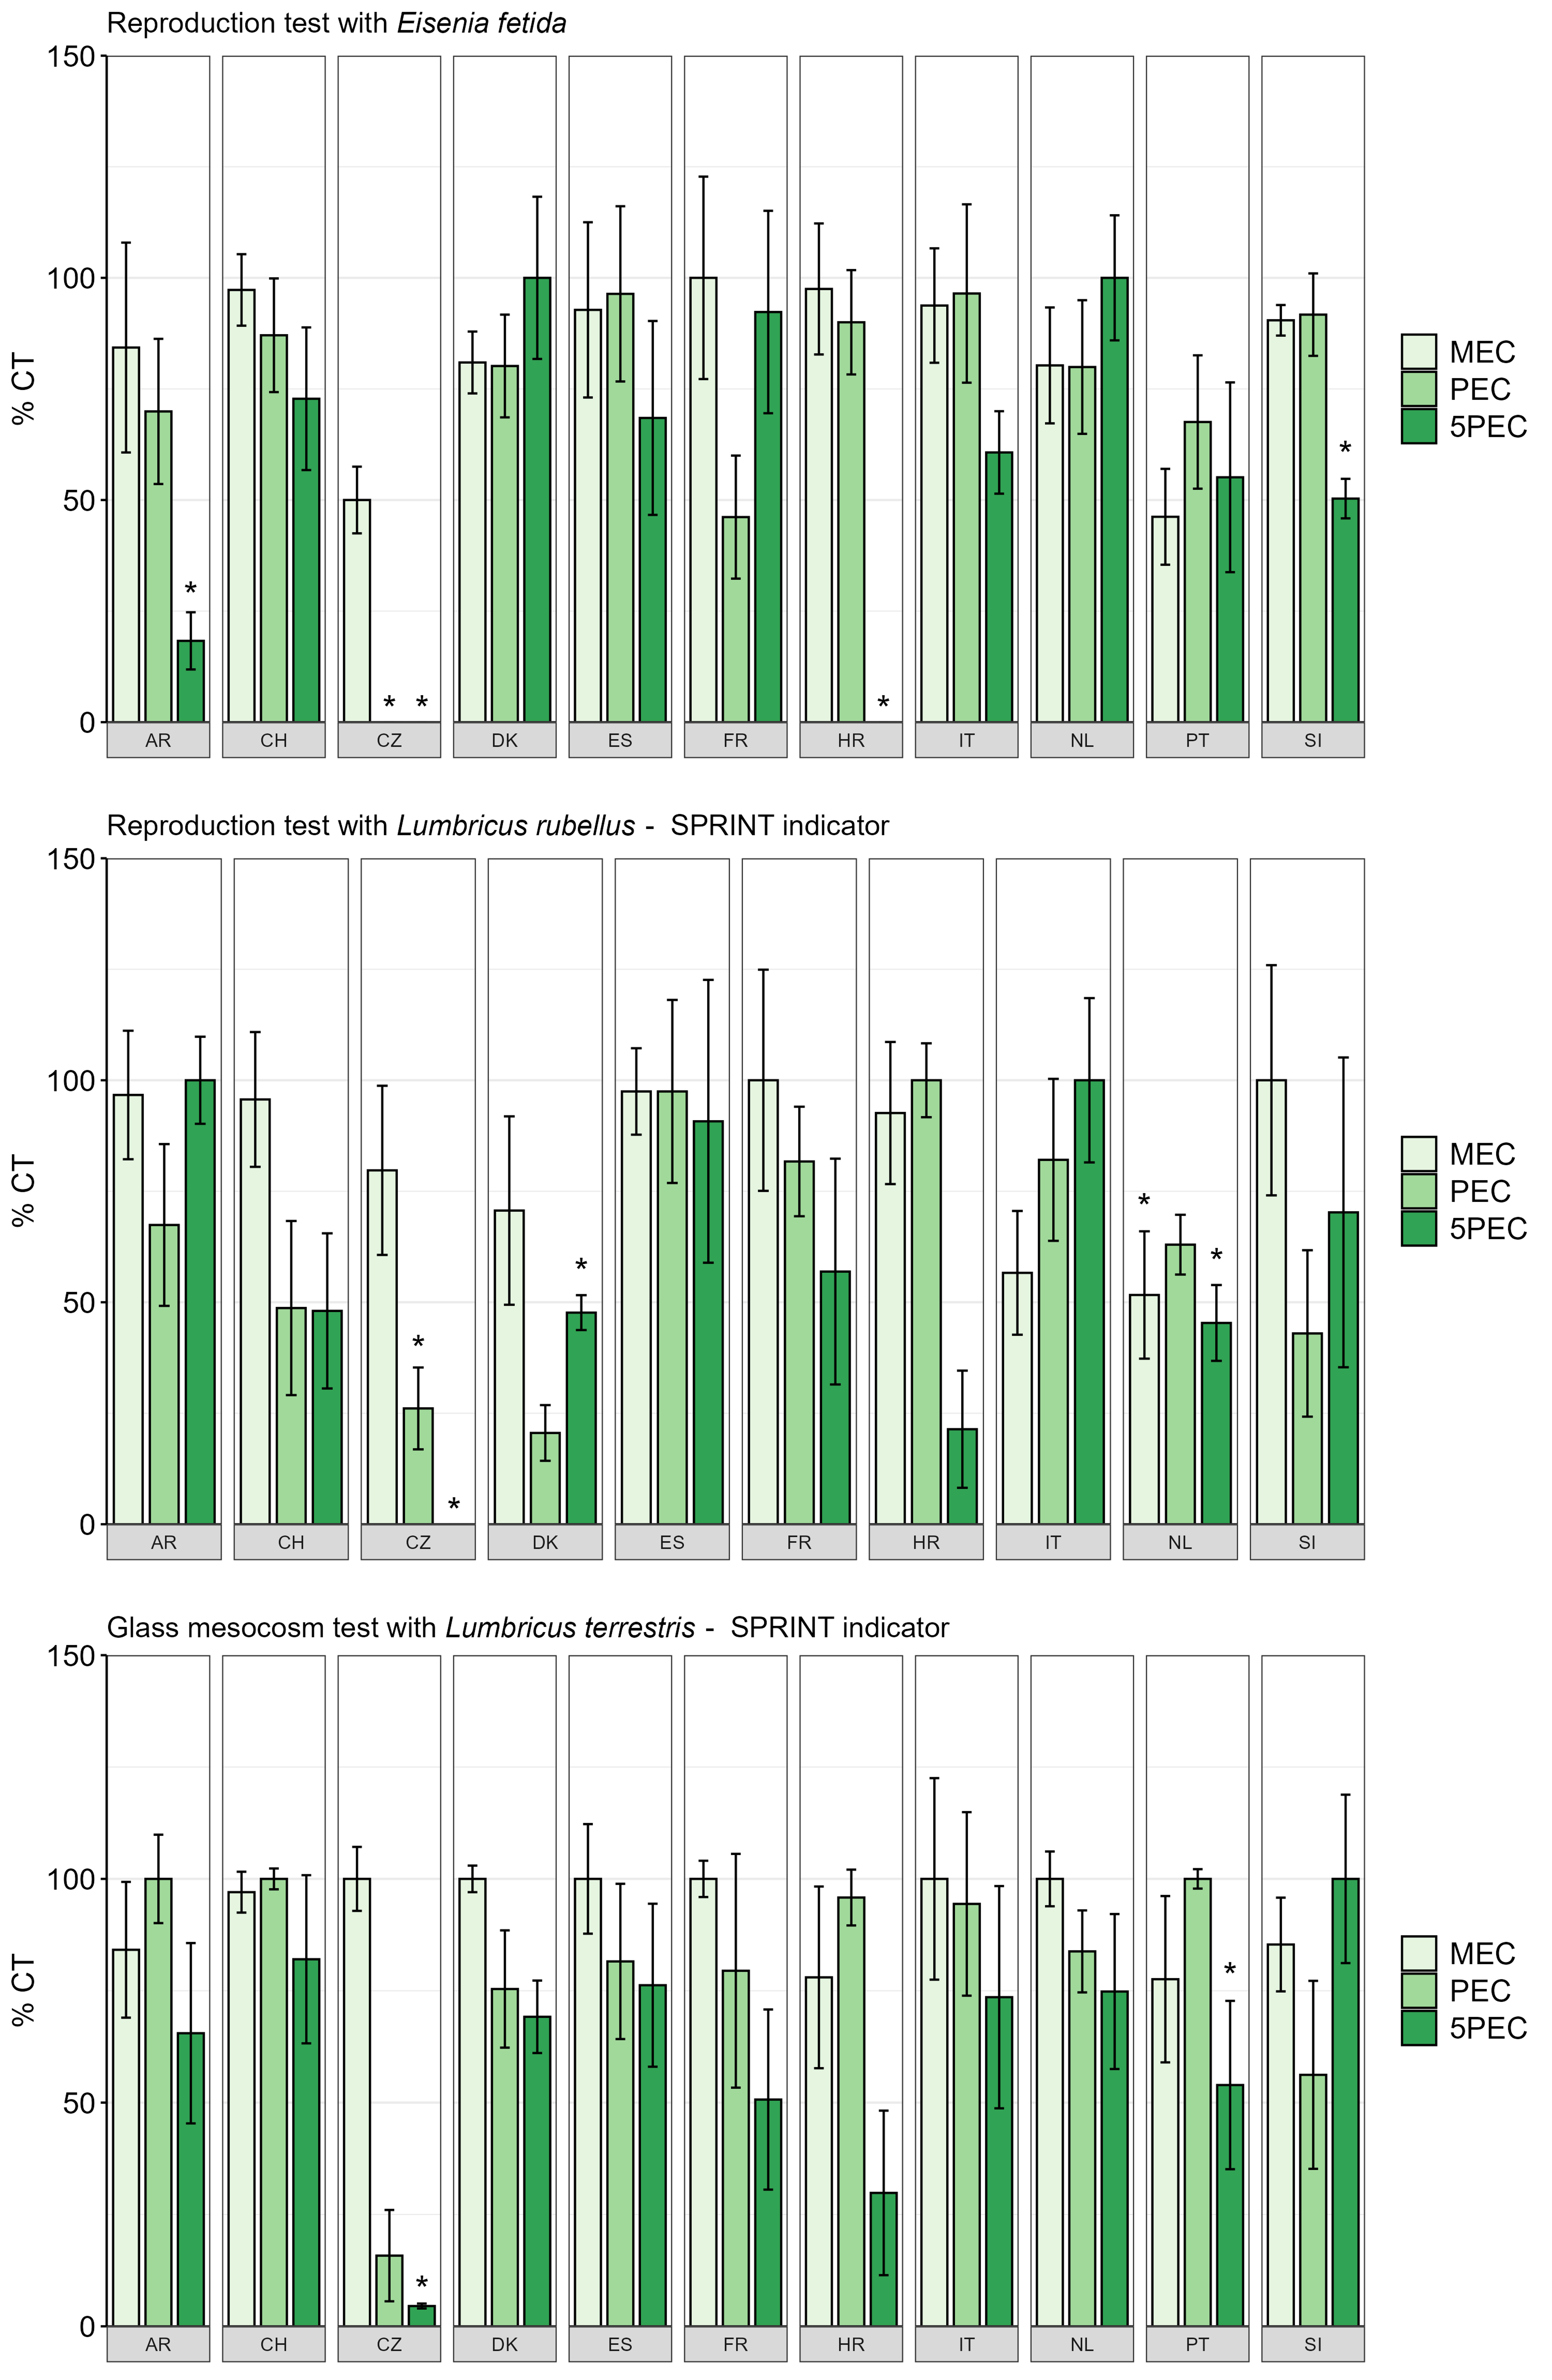
Percentage of juveniles produced in relation to solvent control for the earthworm Eisenia fetida (top) Lumbricus rubellus (middle), and percentage of growth in relation to solvent control for the earthworm Lumbricus terrestris (bottom). Earthworms were exposed to median environmental concentration (MEC), predicted environmental concentration (PEC), and five times PEC (5PEC). The error bars represent the standard error, and asterisks indicate a significant difference from the control (p < 0.05).
For a comprehensive discussion of these results, see Jegede, O., Meng, F., Osman, R., Silva, V., Peters, P., Gooren, H., Tourinho, P. S., Hochmanová, Z., Šmídová, K., Aparicio, V., Hofman, J., Geissen, V., 2026. Assessing the toxicity of environmentally-relevant pesticide mixtures on earthworms, Eisenia fetida and Lumbricus rubellus in European and Argentine cropping systems. Environmental Research, 289, 123304. https://doi.org/10.1016/j.envres.2025.123304.
Springtails
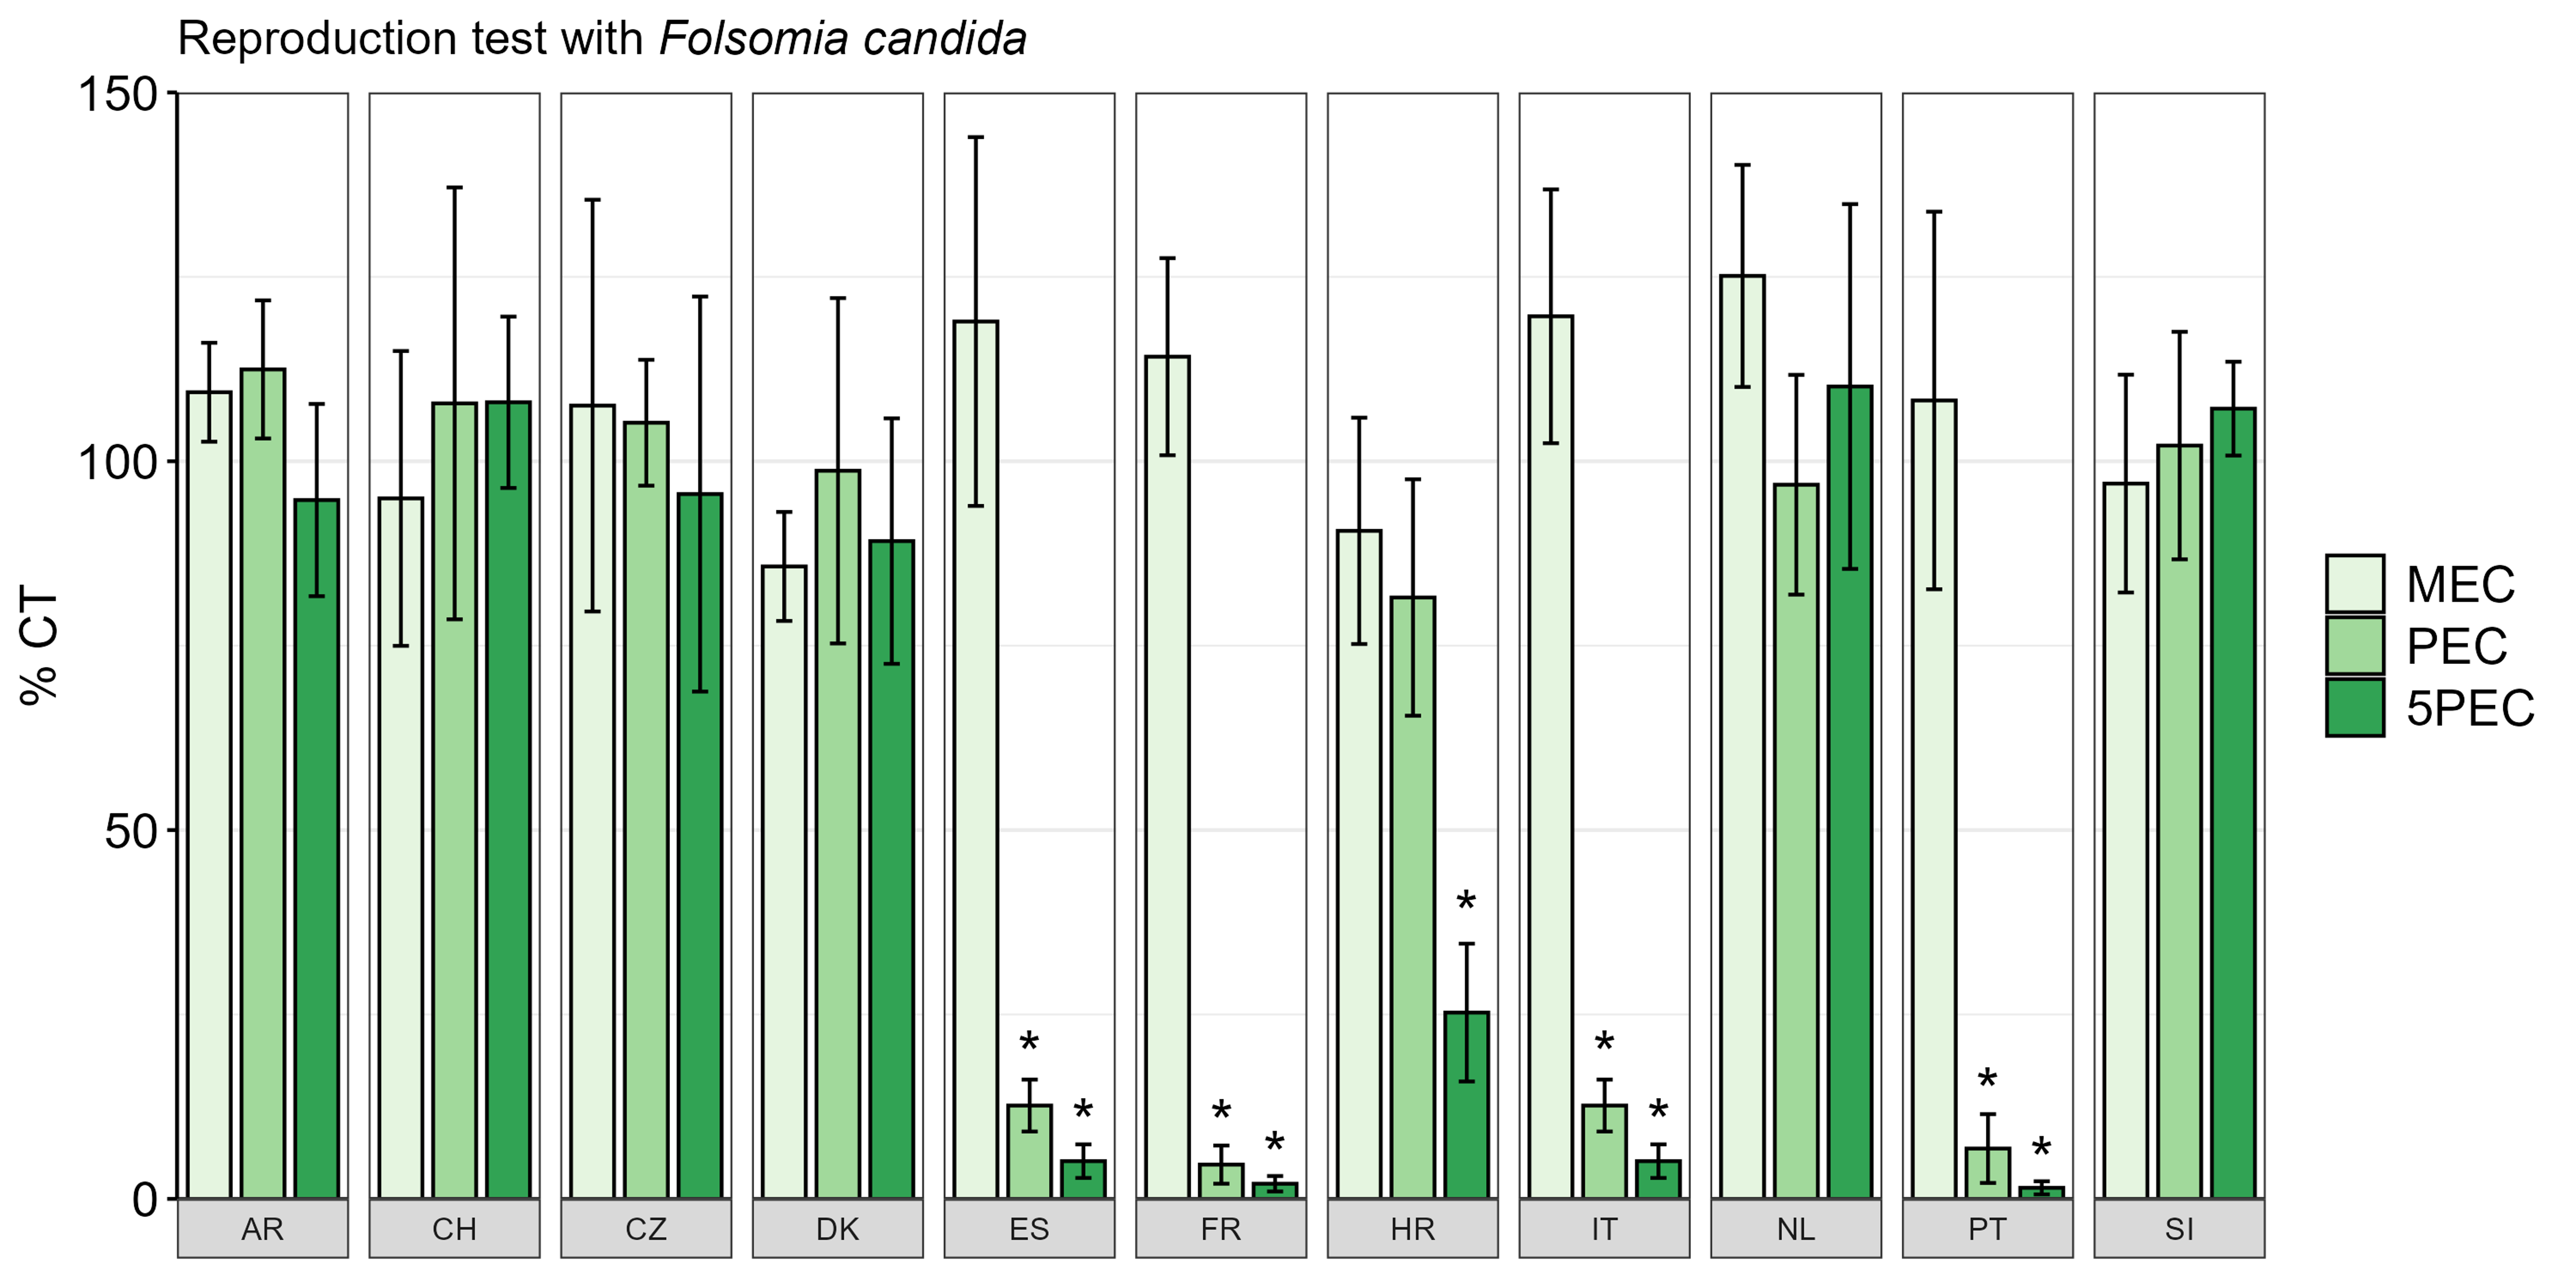
Percentage of juveniles produced in relation to solvent controls. The springtail Folsomia candida was exposed to median environmental concentration (MEC), predicted environmental concentration (PEC), and five times PEC (5PEC). Error bars represent standard deviations. Asterisks indicate a significant difference from the control (p < 0.05).
For a comprehensive discussion of these results, see Tourinho, P.S., Hochmanová, Z., Kukučka, P., Jegede, O., Silva, V., Aparicio, V., Hofman, J., 2025. Effects of realistic pesticide mixtures on the springtail Folsomia candida. Environmental Toxicology and Chemistry 44, 1347–1356. https://doi.org/10.1093/etojnl/vgaf057.
Terrestrial plants
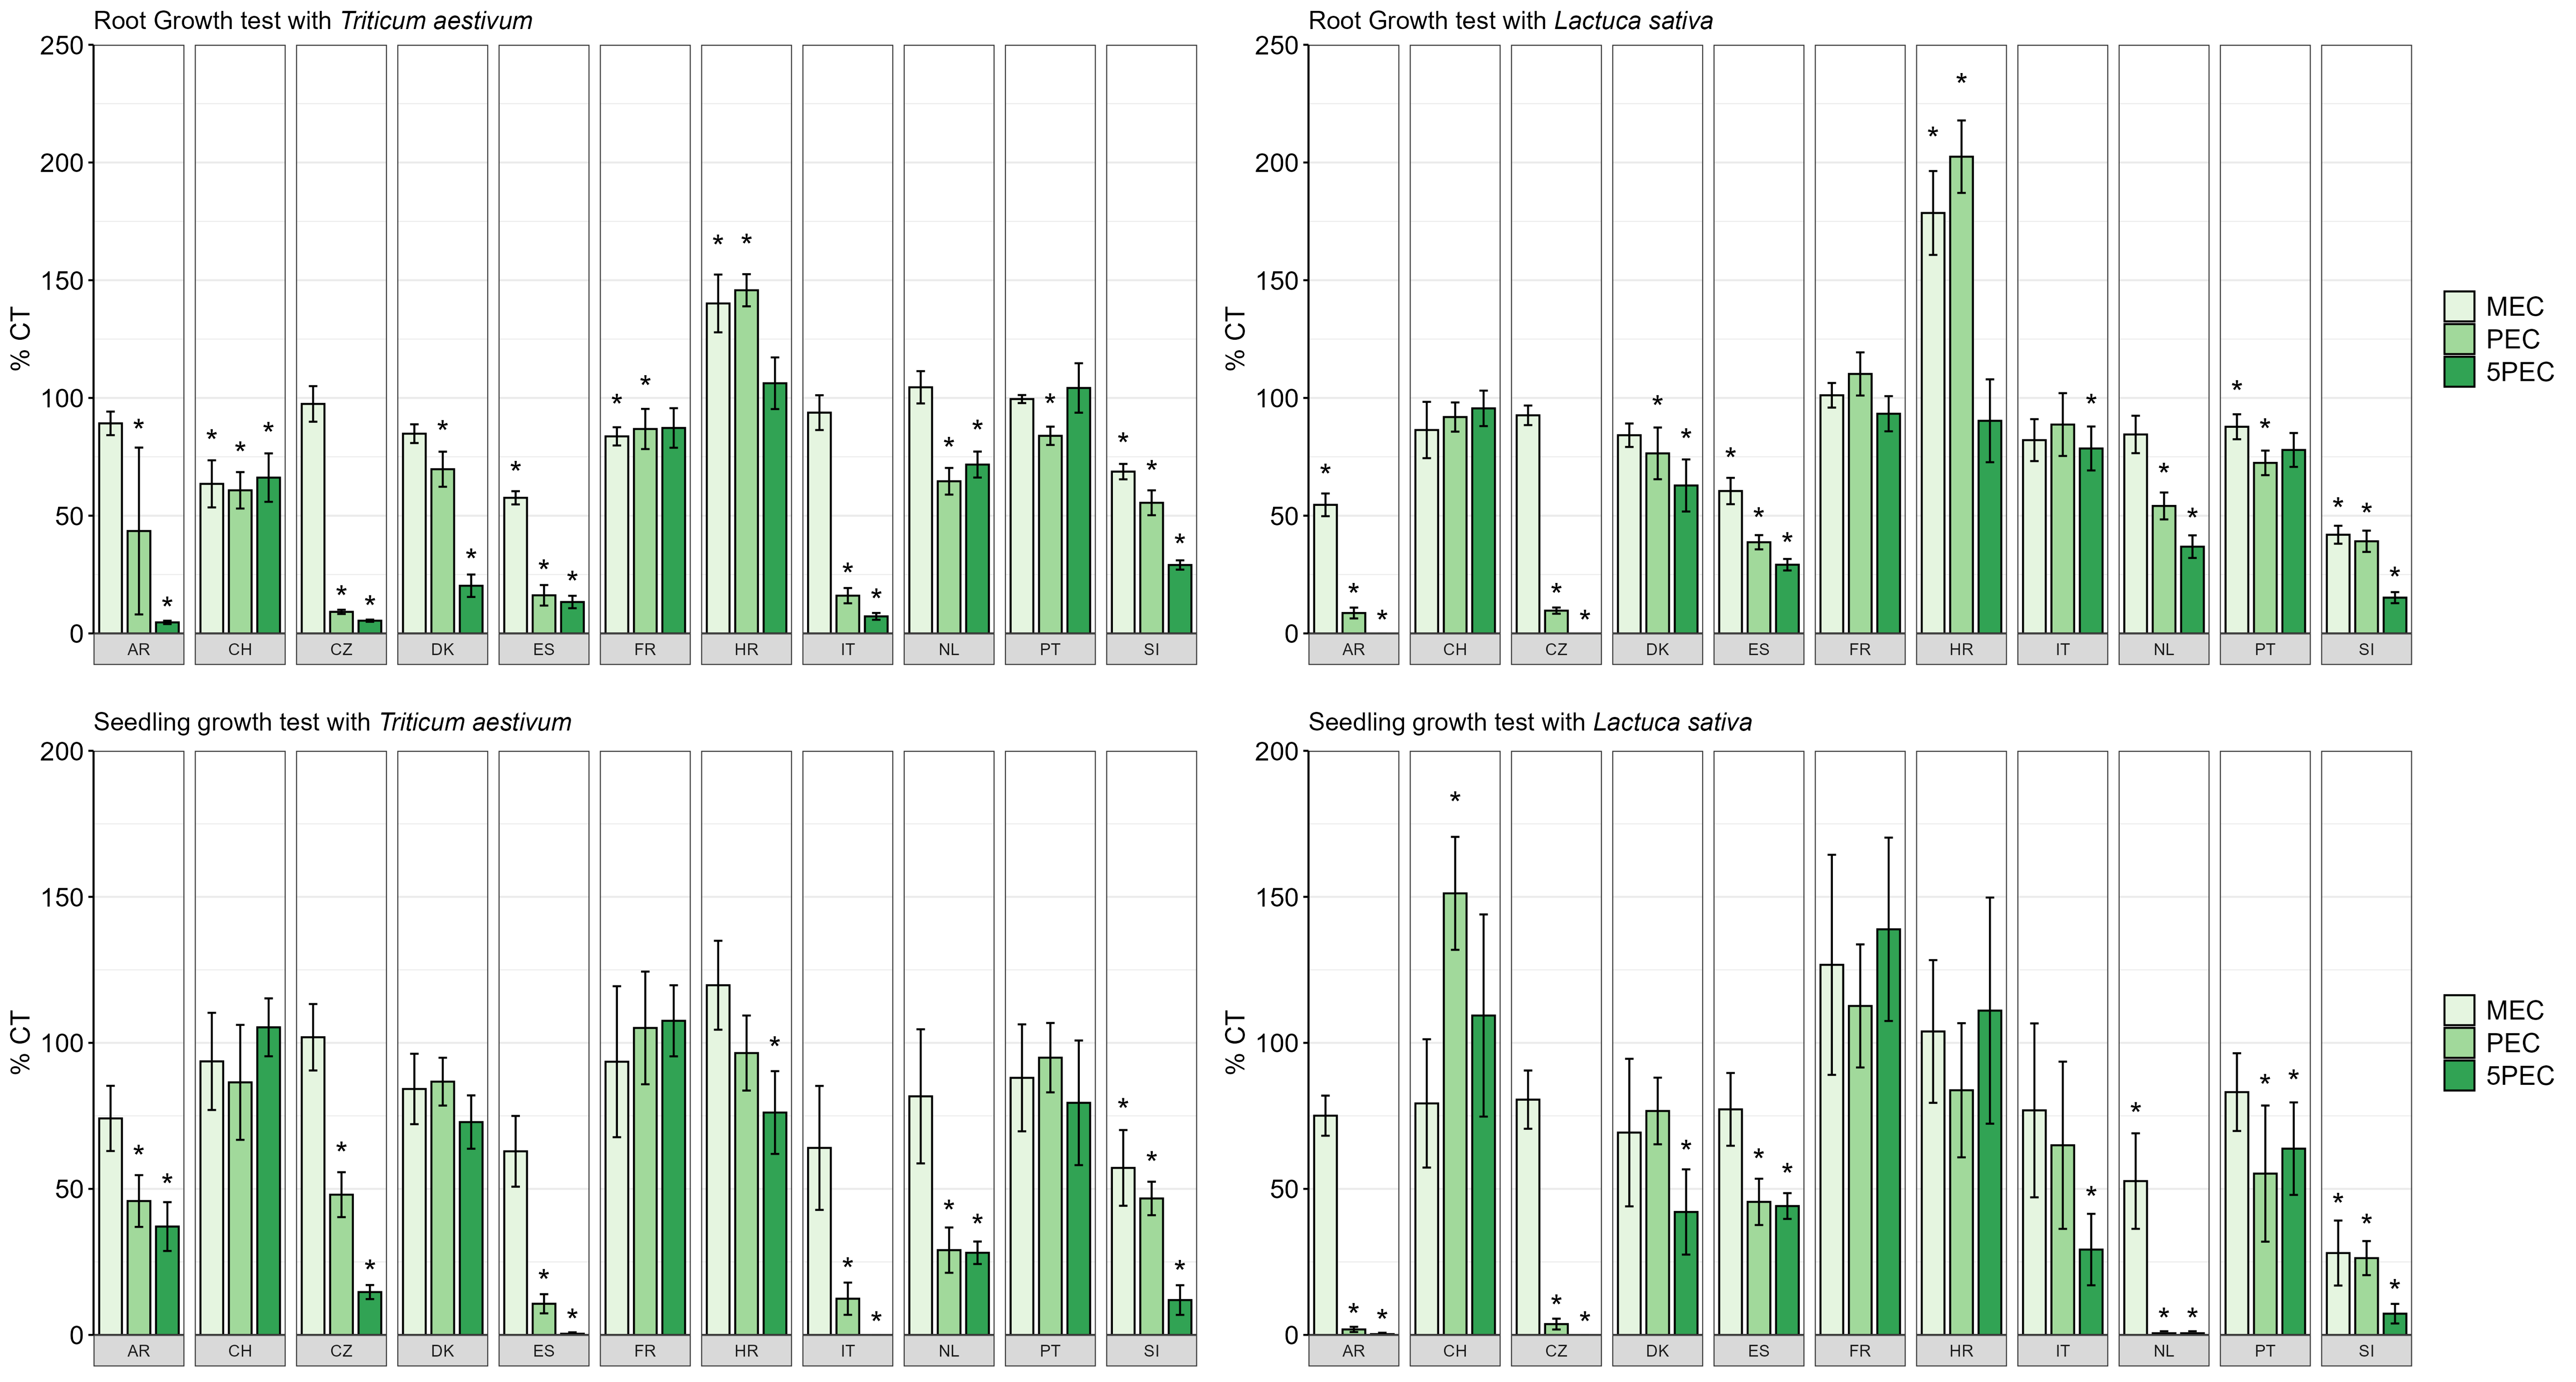
Percentage of root size (top, root growth inhibition test) and shoot weight (bottom, seedling emergence and growth test) relative to the solvent control. Wheat (Triticum aestivum) and lettuce (Lactuca sativa) exposed to median environmental concentration (MEC), predicted environmental concentration (PEC), and five times PEC (5PEC). Error bars represent standard deviations. Asterisks indicate a significant difference from the control (p < 0.05).
Microbial activity
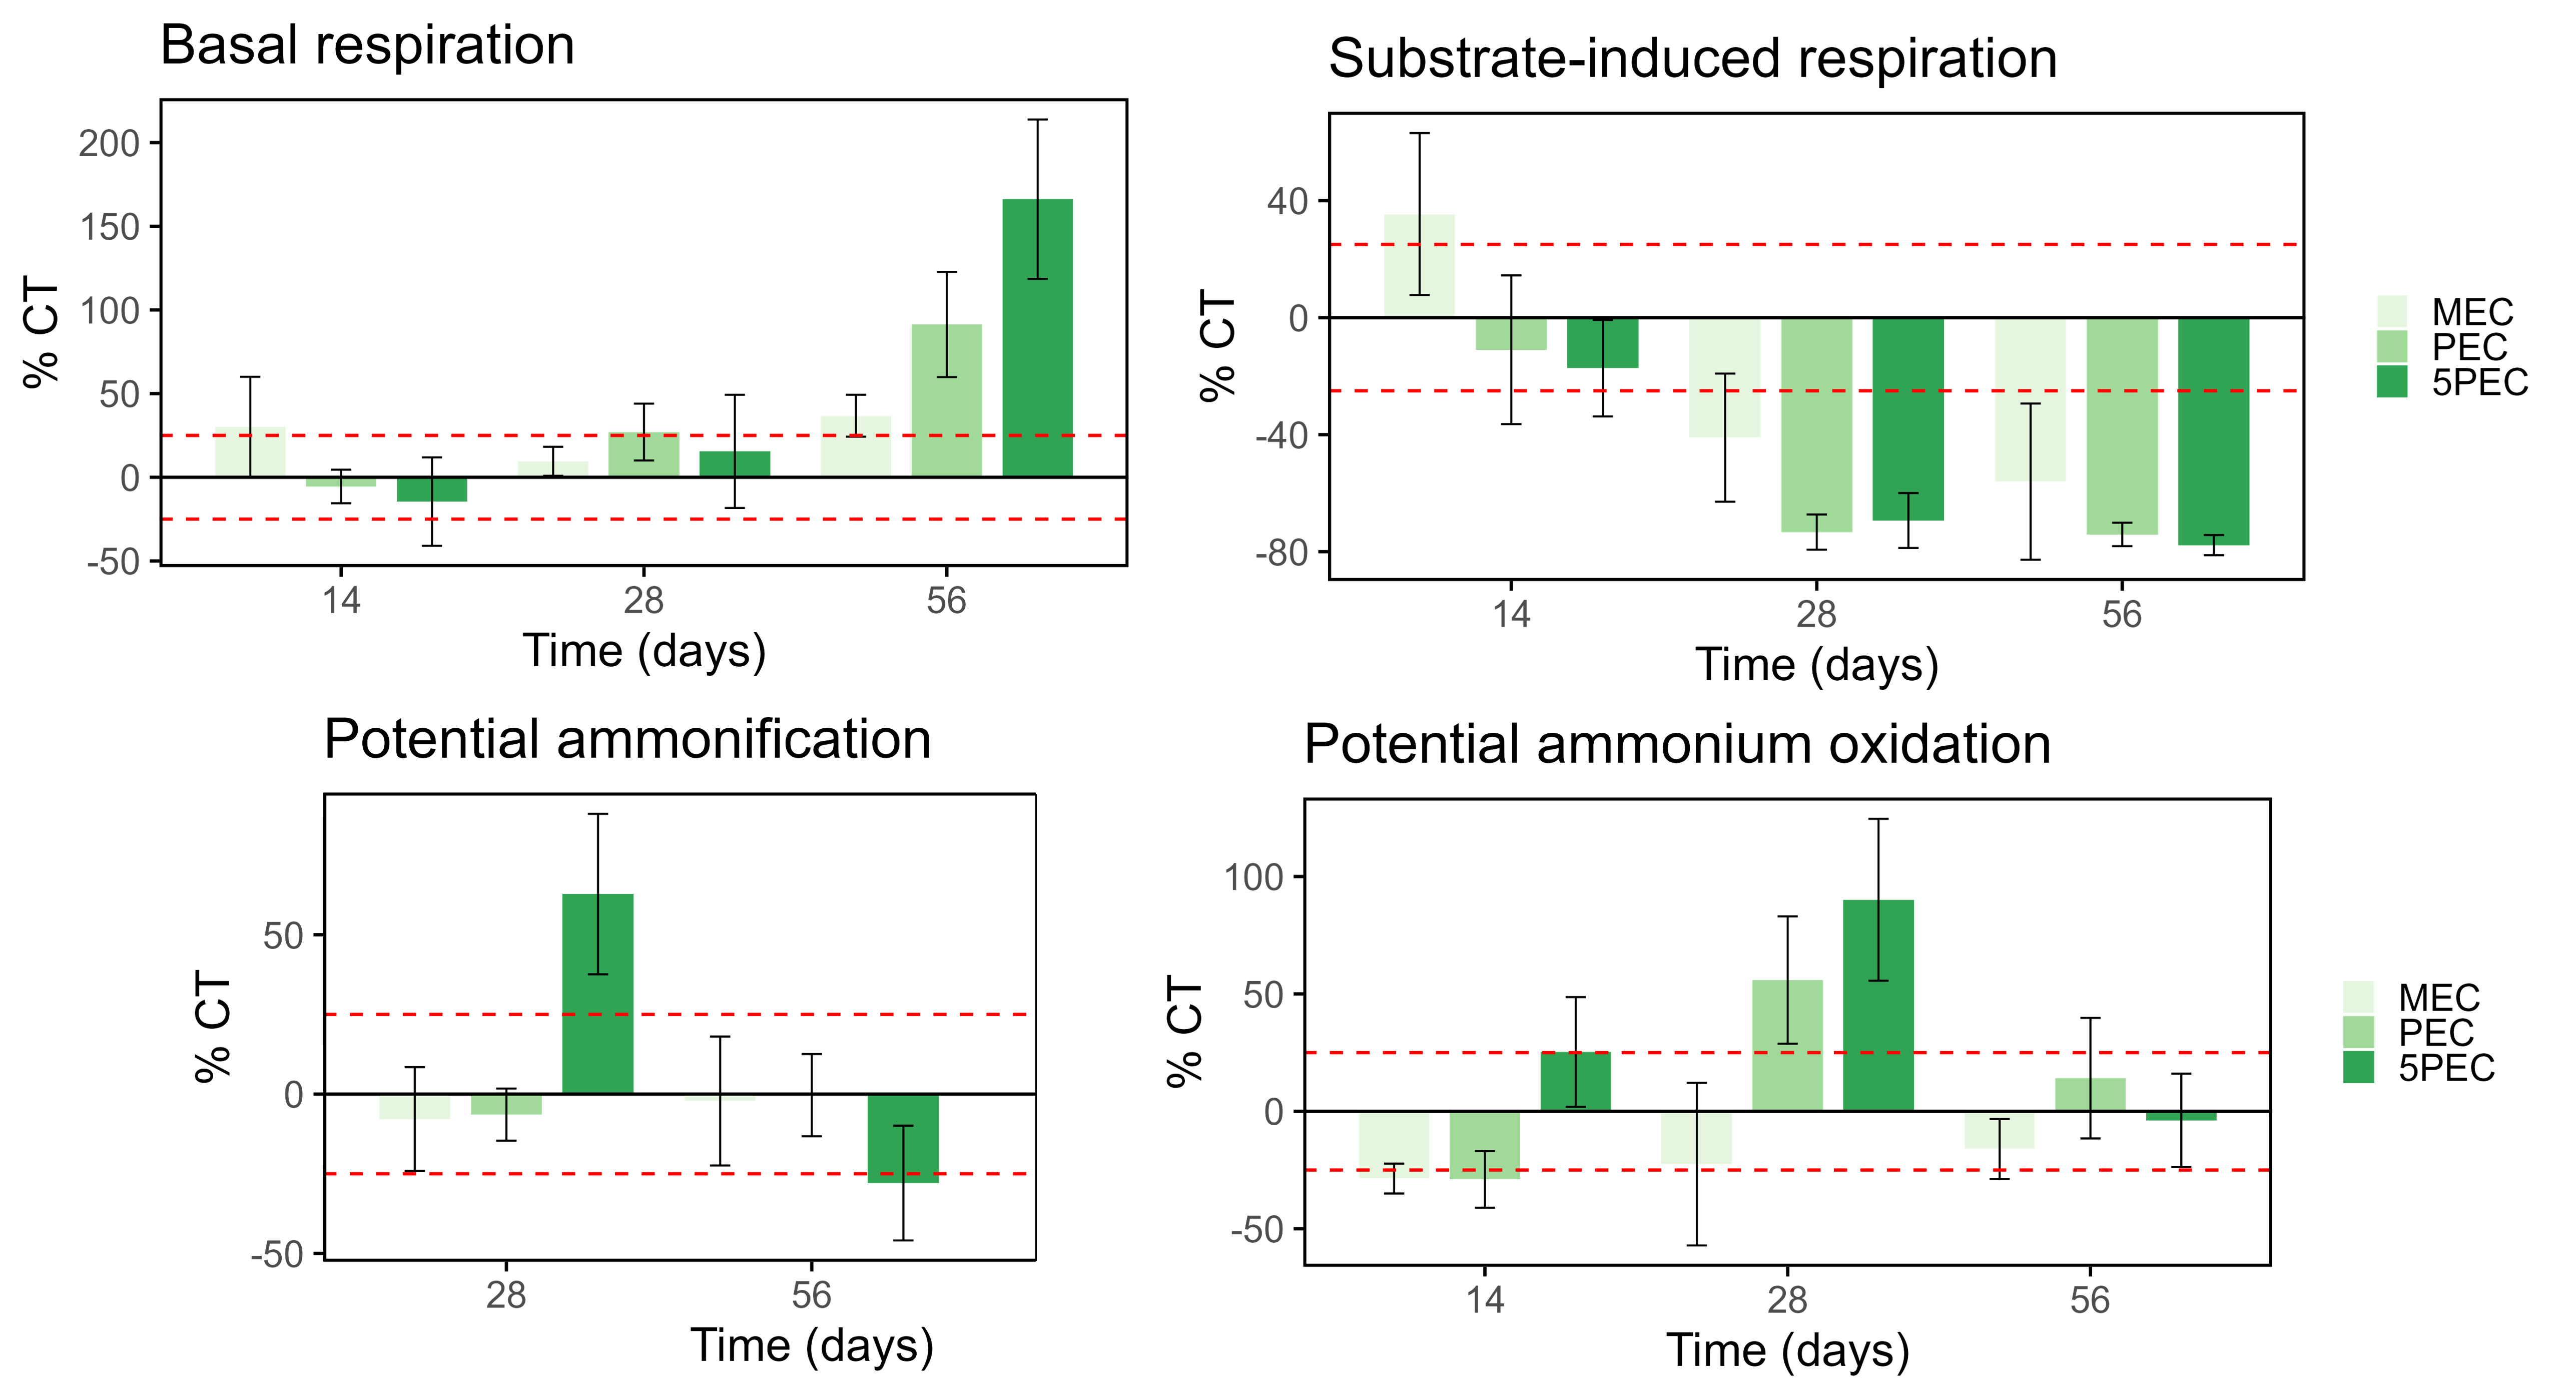
Effects on microbial activity expressed as percentage deviation from the solvent control after 28 and 56 days of incubation at median environmental concentration (MEC), predicted environmental concentration (PEC), and five times PEC (5PEC). Error bars represent standard deviations. EU regulation for evaluation and authorization of plant protection products defines a 25% deviation from the control as the threshold for unacceptable effects.
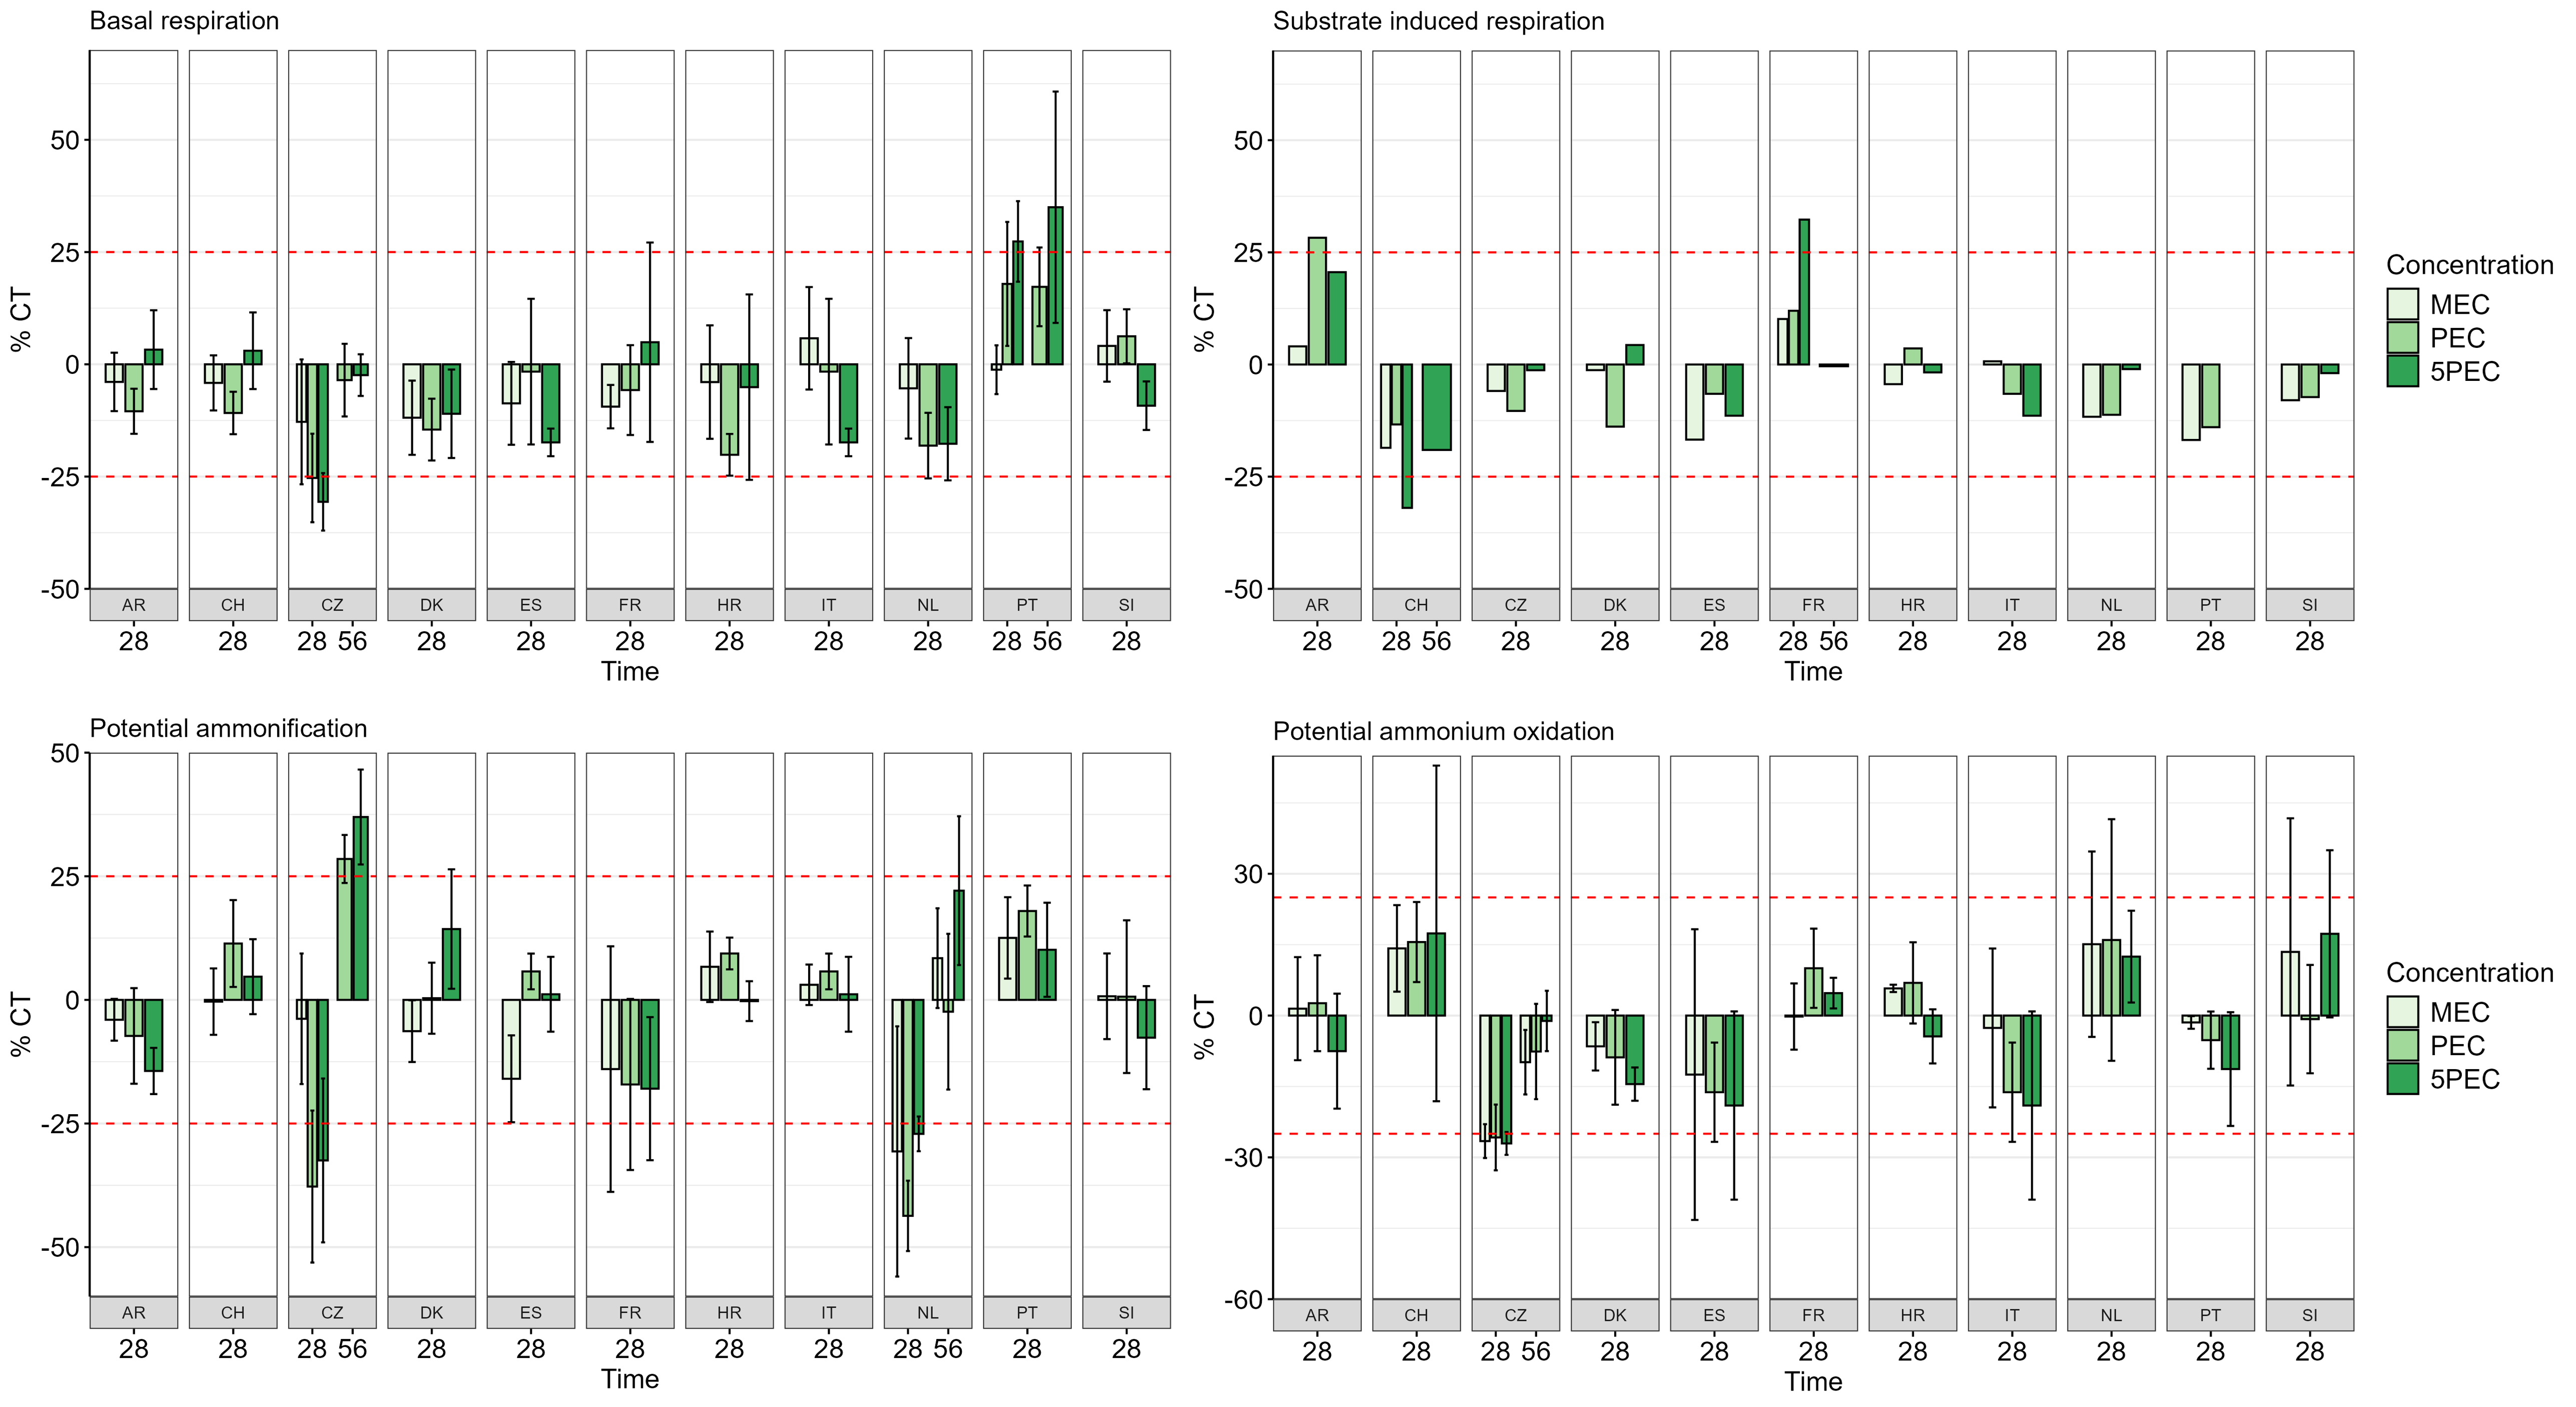 AR = Argentina; CH = Switzerland; CZ = Czech Republic; DK = Denmark; ES = Spain; FR = France; HR = Croatia; IT = Italy; NL = The Netherlands; PT = Portugal; SI = Slovenia
Bees
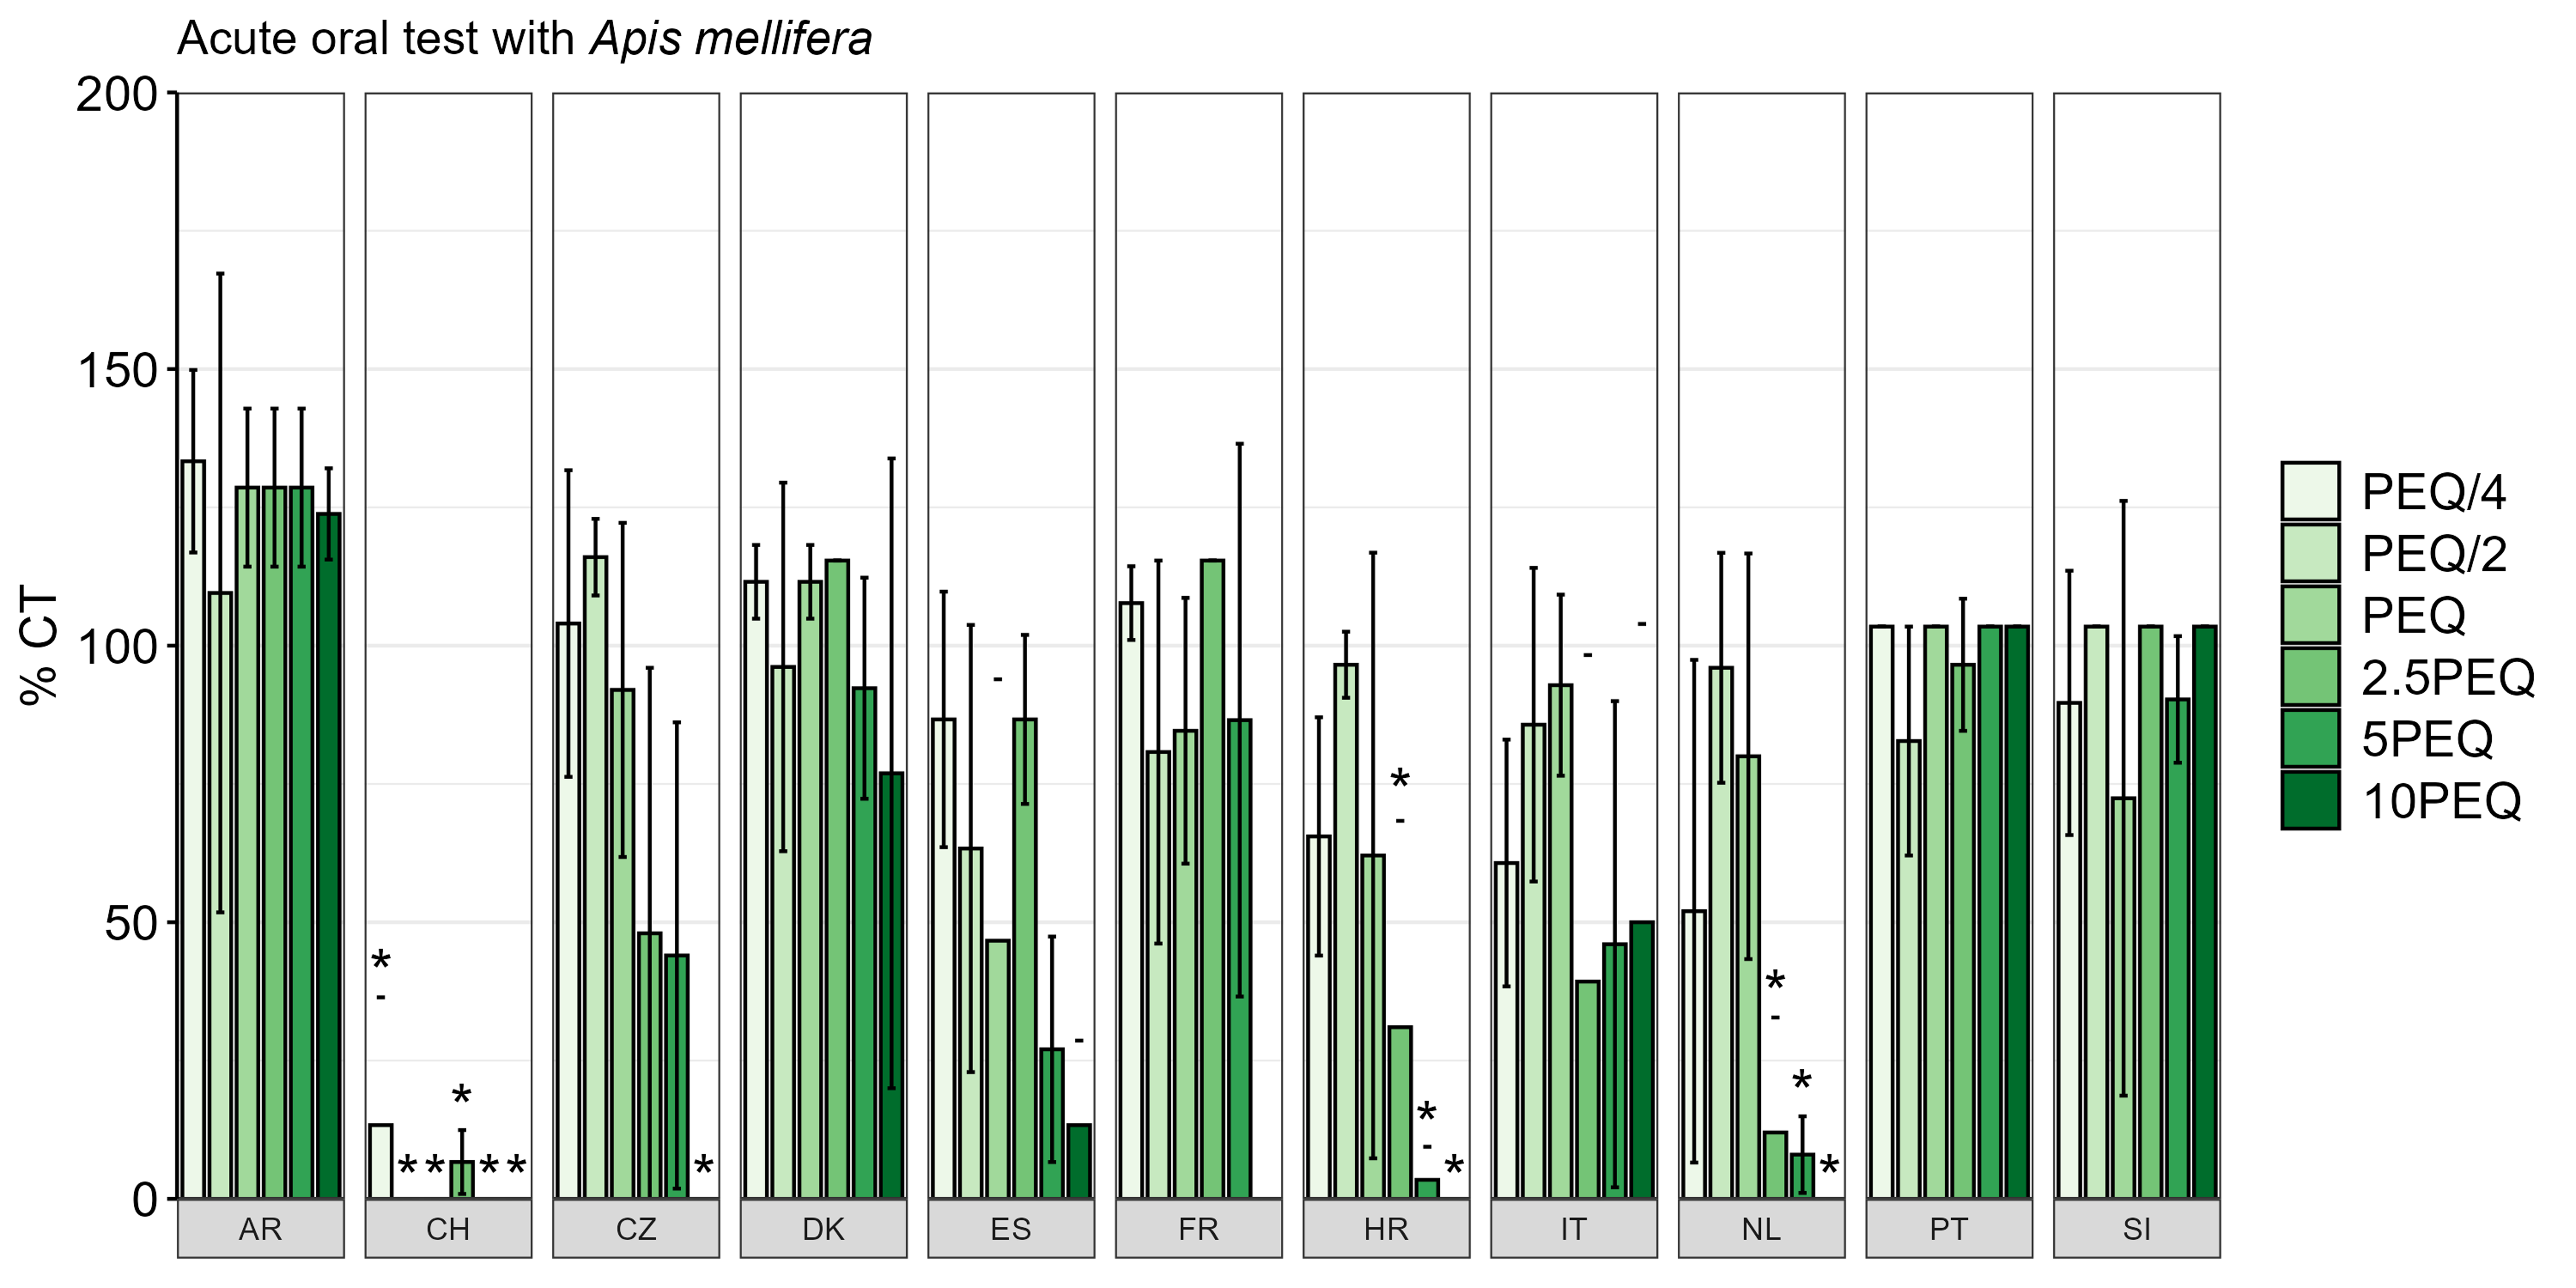
Percentage of survival of Apis mellifera 48 hours after oral exposure. Bees were exposed to different ratios of the predicted dietary exposure quantity (PEQ). Error bars represent the standard deviation. Asterisks indicate a significant difference in survival with the solvent control (p<.05).
Beneficial insects
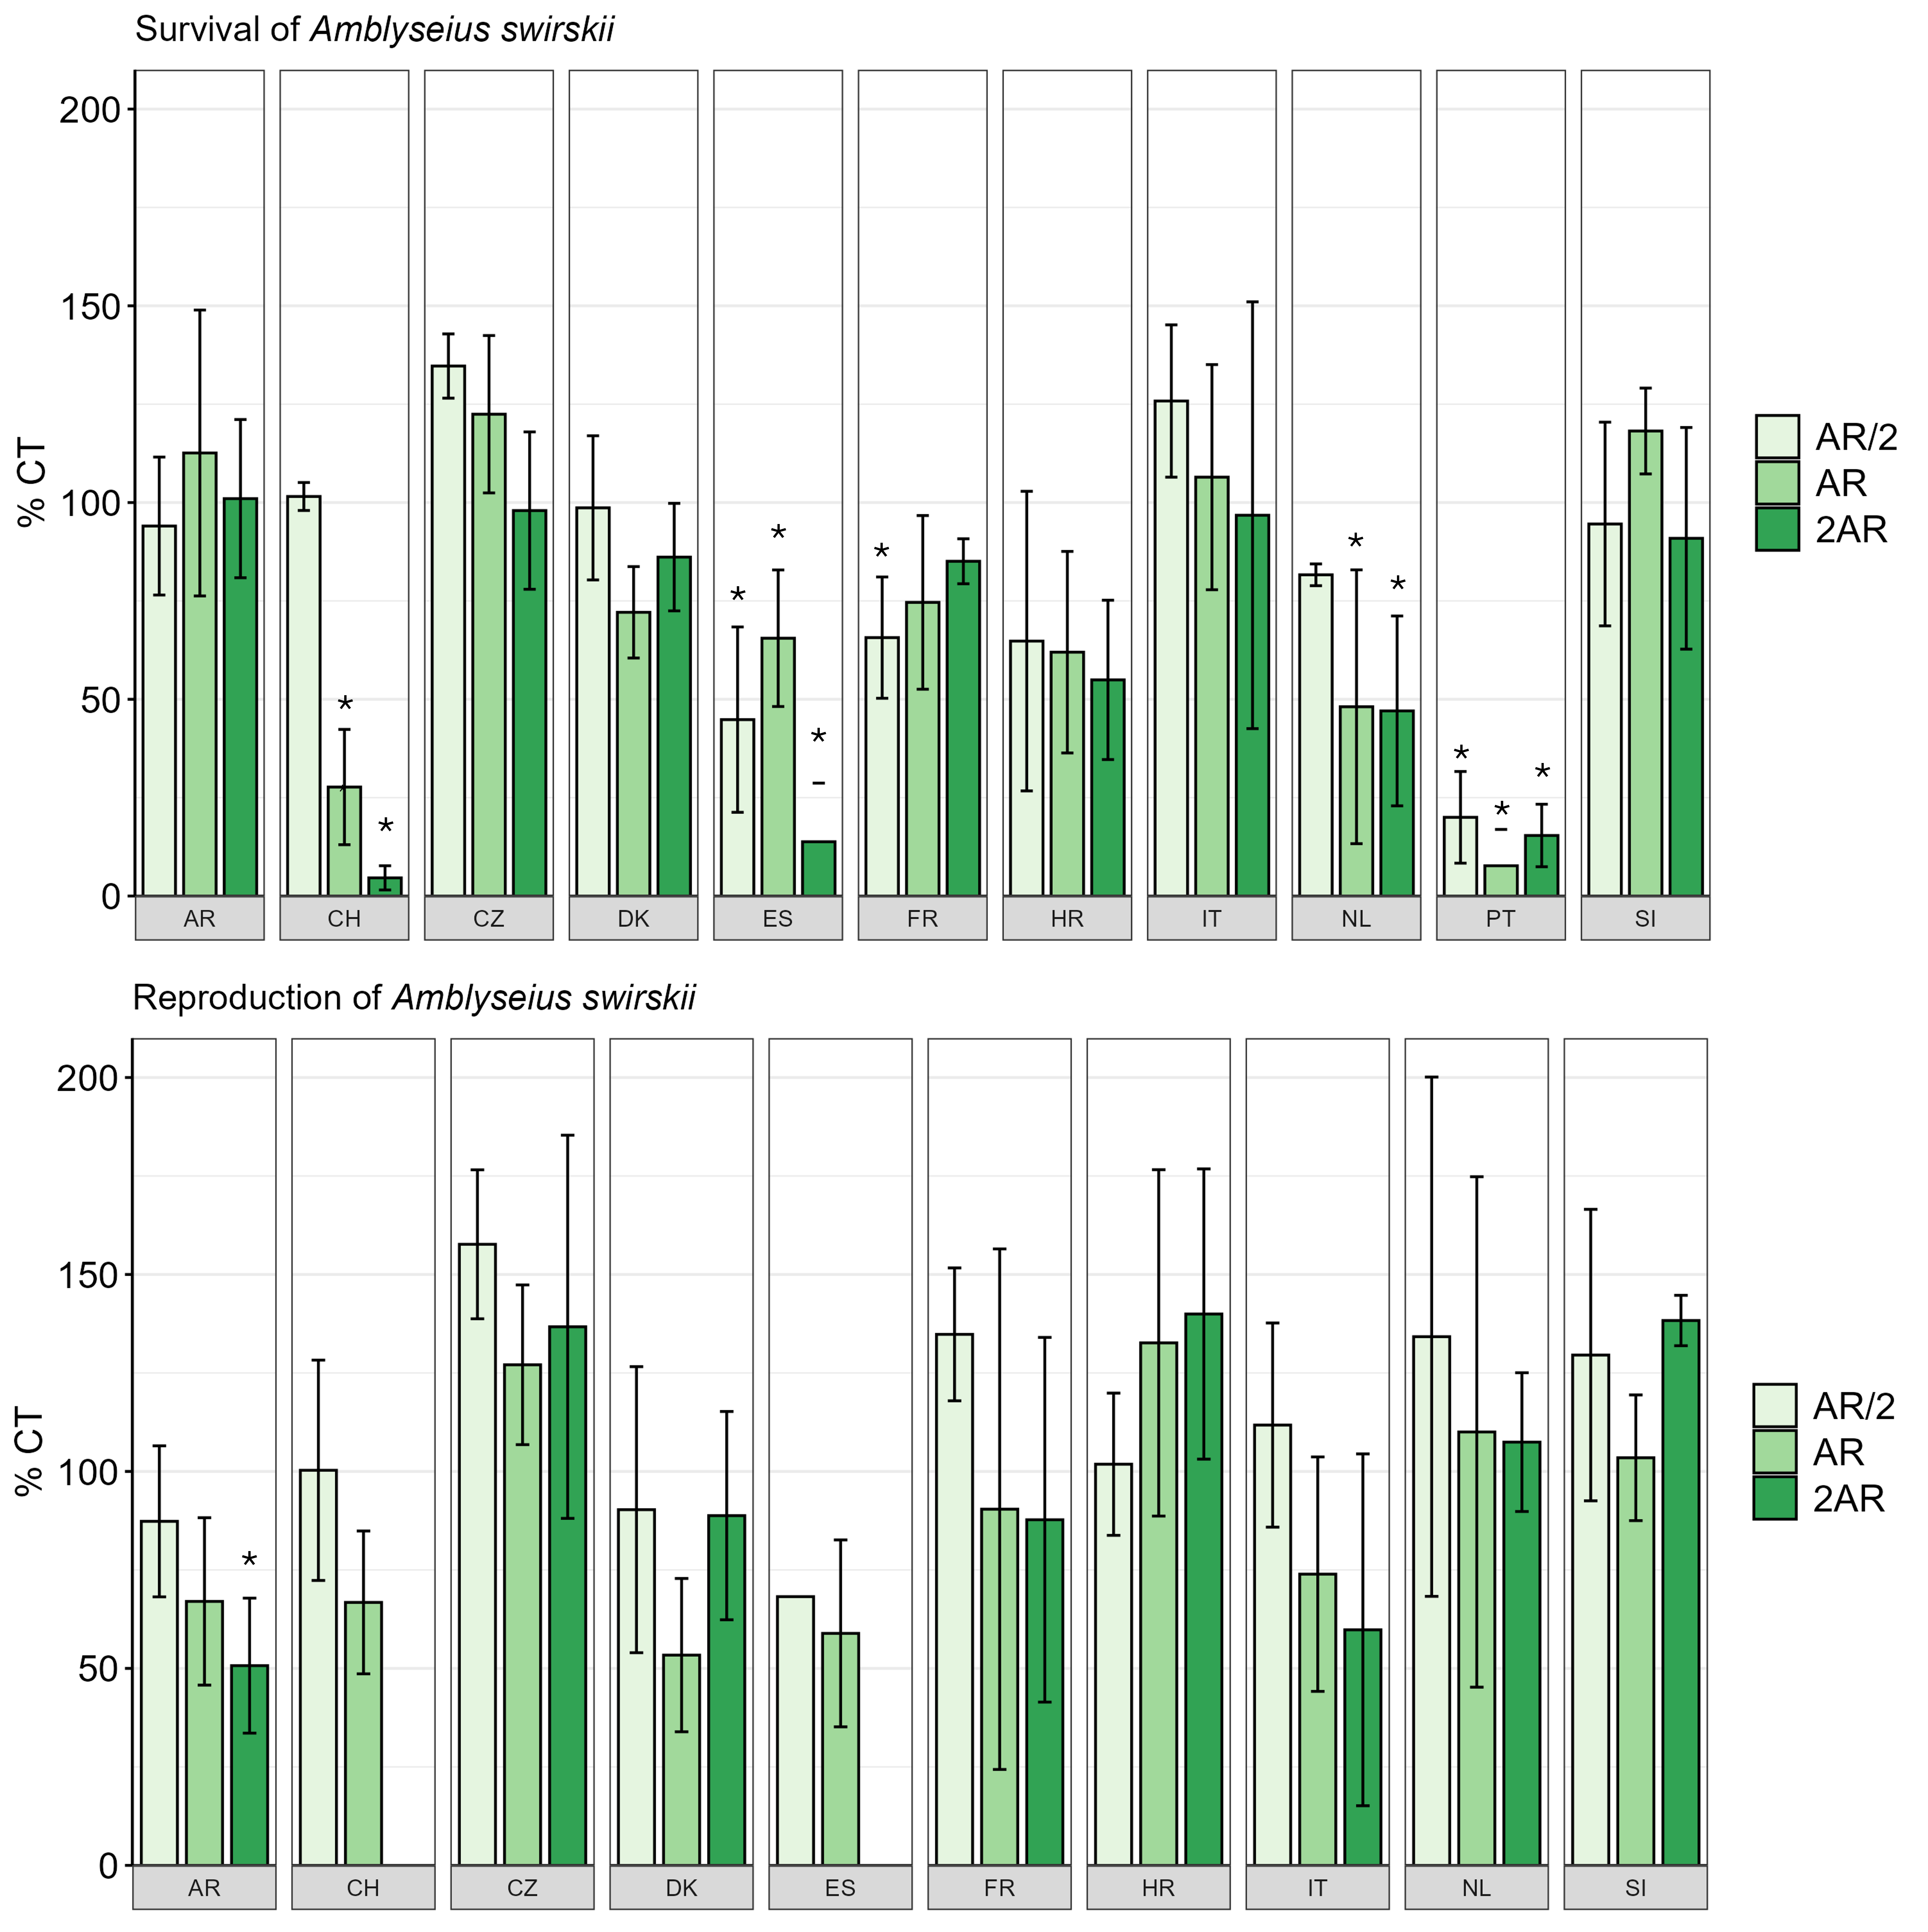
Percentage of survival (top) and juvenile production (bottom) of Amblyseius swirskii presented relative to the solvent control. Predatory mites were exposed to different ratios of the application rate (AR). Error bars represent the standard deviation. Asterisks indicate a significant difference from the solvent control (p<.05).
Microcosms
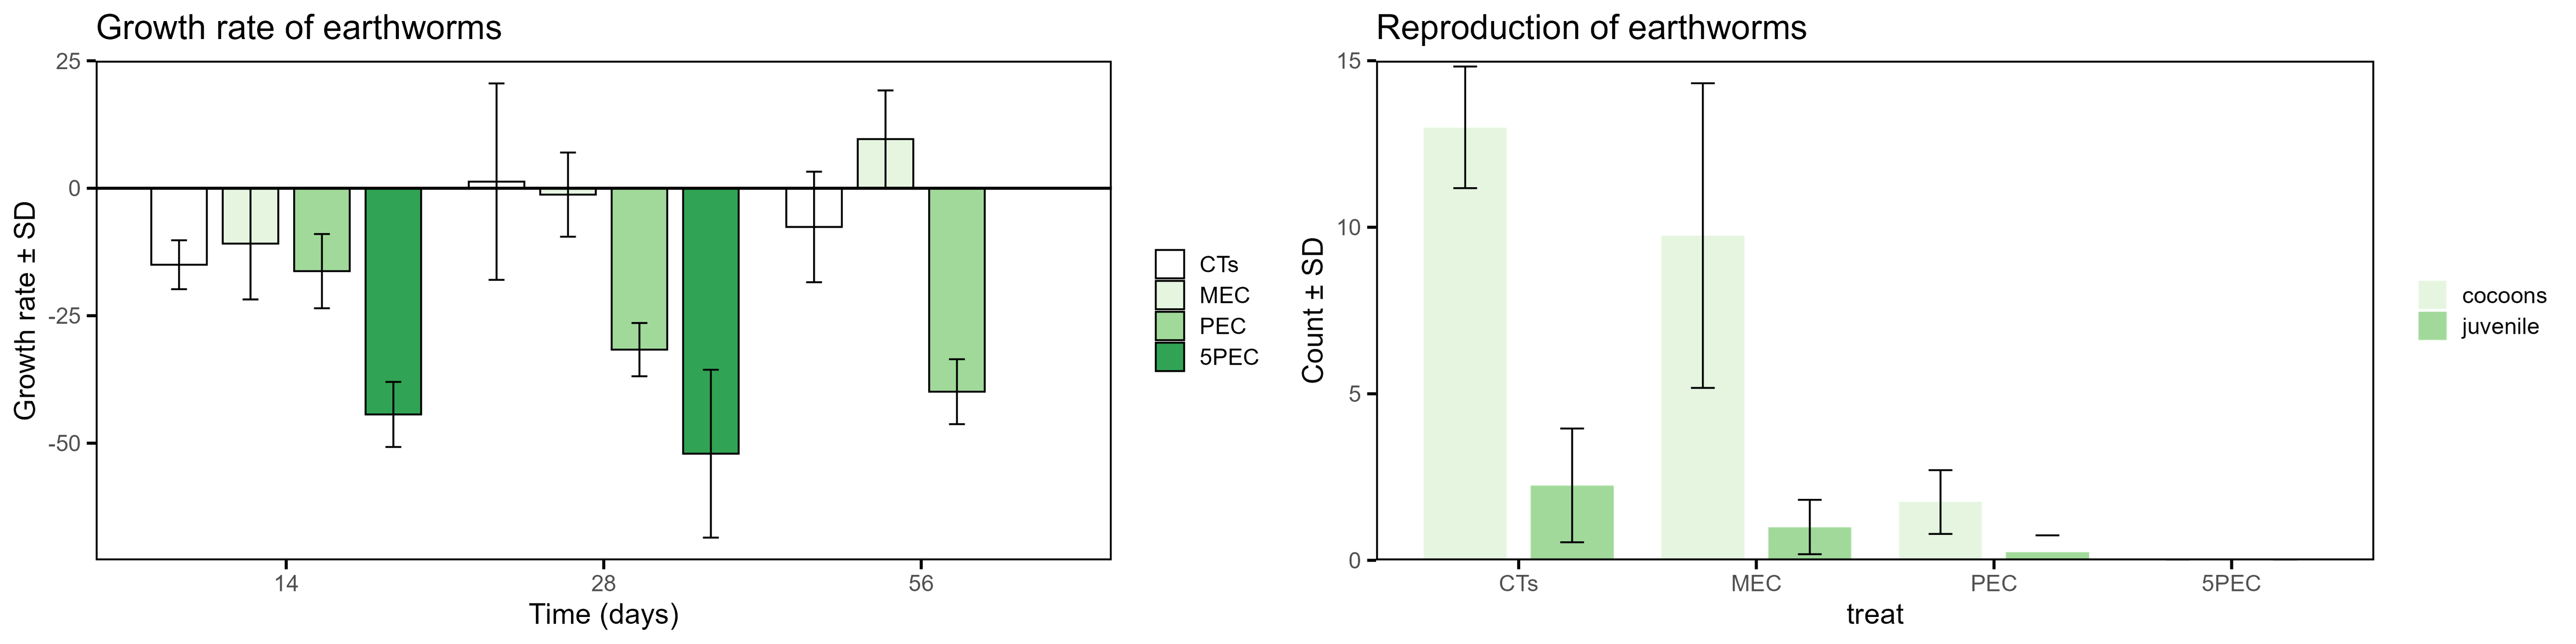
Growth rate (% of initial weight) of adult earthworms (left), and reproduction of cocoons and juveniles (right) in earthworms (Lumbricus rubellus) after 14, 28, and 56 days of exposure in negative control (CT), solvent controls (CTs), measured environmental concentration (MEC), predicted environmental concentration (PEC), and 5 times PEC (5PEC) based on the results of residues in CZ. Bars represent mean values and error bars represent standard deviations. Letters represent statistical differences (p<0.05).
Effects on microbial activity expressed as percentage deviation from the solvent control after 14, 28 and 56 days of incubation at median environmental concentration (MEC), predicted environmental concentration (PEC), and five times PEC (5PEC) based on the results of residues in CZ. Error bars represent standard deviations. EU regulation for evaluation and authorization of plant protection products defines a 25% deviation from the control as the threshold for unacceptable effects.